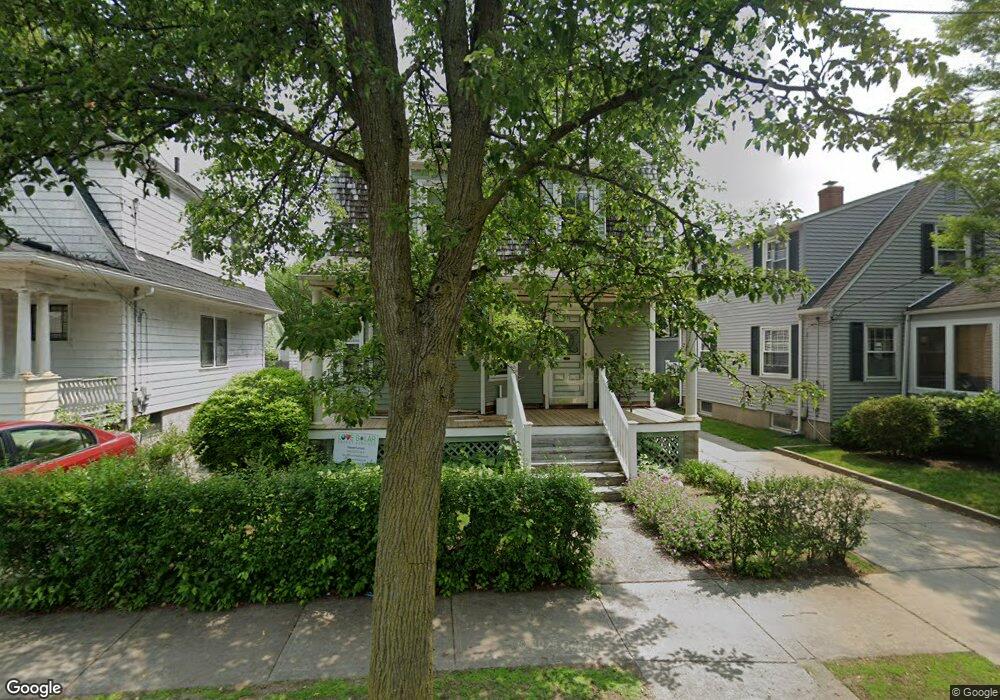
139 Nelson St Providence, RI 02908
Elmhurst NeighborhoodEstimated Value: $416,257 - $482,000
3
Beds
2
Baths
1,377
Sq Ft
$330/Sq Ft
Est. Value
About This Home
This home is located at 139 Nelson St, Providence, RI 02908 and is currently estimated at $455,064, approximately $330 per square foot. 139 Nelson St is a home located in Providence County with nearby schools including St. Pius V Catholic School, St. Augustine School, and Blessed Sacrament School.
Ownership History
Date
Name
Owned For
Owner Type
Purchase Details
Closed on
Jul 28, 1990
Sold by
Est Hazelhurst Hope C
Bought by
Sharkey Peter T
Current Estimated Value
Create a Home Valuation Report for This Property
The Home Valuation Report is an in-depth analysis detailing your home's value as well as a comparison with similar homes in the area
Home Values in the Area
Average Home Value in this Area
Purchase History
| Date | Buyer | Sale Price | Title Company |
|---|---|---|---|
| Sharkey Peter T | $100,000 | -- |
Source: Public Records
Mortgage History
| Date | Status | Borrower | Loan Amount |
|---|---|---|---|
| Open | Sharkey Peter T | $160,600 | |
| Closed | Sharkey Peter T | $165,000 | |
| Closed | Sharkey Peter T | $109,000 | |
| Closed | Sharkey Peter T | $100,530 |
Source: Public Records
Tax History
| Year | Tax Paid | Tax Assessment Tax Assessment Total Assessment is a certain percentage of the fair market value that is determined by local assessors to be the total taxable value of land and additions on the property. | Land | Improvement |
|---|---|---|---|---|
| 2025 | $3,121 | $371,600 | $160,000 | $211,600 |
| 2024 | $4,683 | $255,200 | $104,000 | $151,200 |
| 2023 | $4,683 | $255,200 | $104,000 | $151,200 |
| 2022 | $4,543 | $255,200 | $104,000 | $151,200 |
| 2021 | $4,214 | $171,600 | $79,300 | $92,300 |
| 2020 | $4,214 | $171,600 | $79,300 | $92,300 |
| 2019 | $4,214 | $171,600 | $79,300 | $92,300 |
| 2018 | $4,184 | $130,900 | $63,800 | $67,100 |
| 2017 | $4,184 | $130,900 | $63,800 | $67,100 |
| 2016 | $4,184 | $130,900 | $63,800 | $67,100 |
| 2015 | $4,283 | $129,400 | $63,800 | $65,600 |
| 2014 | $4,367 | $129,400 | $63,800 | $65,600 |
| 2013 | $4,367 | $129,400 | $63,800 | $65,600 |
Source: Public Records
Map
Nearby Homes
Your Personal Tour Guide
Ask me questions while you tour the home.