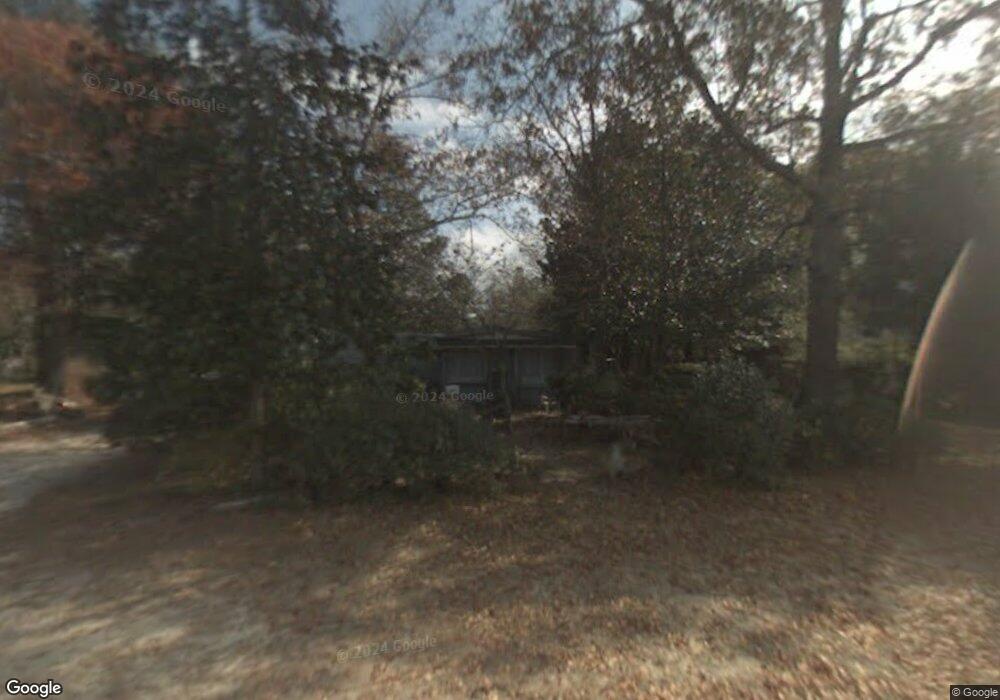
139 Newman Rd Ellabell, GA 31308
Estimated Value: $10,923 - $545,000
2
Beds
1
Bath
516
Sq Ft
$411/Sq Ft
Est. Value
About This Home
This home is located at 139 Newman Rd, Ellabell, GA 31308 and is currently estimated at $211,981, approximately $410 per square foot. 139 Newman Rd is a home located in Bryan County with nearby schools including Lanier Primary School, Bryan County Elementary School, and Bryan County Middle School.
Ownership History
Date
Name
Owned For
Owner Type
Purchase Details
Closed on
Nov 27, 2024
Sold by
Wilson John W
Bought by
Boswell Christopher
Current Estimated Value
Purchase Details
Closed on
Mar 22, 2019
Sold by
Kamalakis George Rhandall
Bought by
Wilson John W
Purchase Details
Closed on
May 31, 2016
Sold by
Landers Clara J
Bought by
Kamalakis George Rhandall
Purchase Details
Closed on
Jul 11, 2014
Sold by
Jarrell Shirley J
Bought by
Landers Clara J
Purchase Details
Closed on
Nov 16, 2011
Sold by
Newman Harry David
Bought by
Landers Clara Janette
Purchase Details
Closed on
Oct 10, 2011
Sold by
Landers Clara J
Bought by
Jarrell Shirley J Newman Harry D
Purchase Details
Closed on
Aug 11, 2009
Sold by
Newman Pauline
Bought by
Jarrell Shirley J and Newman Harry D
Purchase Details
Closed on
Jan 1, 1982
Bought by
Newman Pauline
Purchase Details
Closed on
Aug 1, 1974
Create a Home Valuation Report for This Property
The Home Valuation Report is an in-depth analysis detailing your home's value as well as a comparison with similar homes in the area
Home Values in the Area
Average Home Value in this Area
Purchase History
| Date | Buyer | Sale Price | Title Company |
|---|---|---|---|
| Boswell Christopher | -- | -- | |
| Wilson John W | -- | -- | |
| Kamalakis George Rhandall | $5,000 | -- | |
| Landers Clara J | -- | -- | |
| Landers Clara Janette | -- | -- | |
| Jarrell Shirley J Newman Harry D | $8,800 | -- | |
| Newman Harry David | -- | -- | |
| Jarrell Shirley J | -- | -- | |
| Newman Pauline | -- | -- | |
| -- | -- | -- |
Source: Public Records
Tax History Compared to Growth
Tax History
| Year | Tax Paid | Tax Assessment Tax Assessment Total Assessment is a certain percentage of the fair market value that is determined by local assessors to be the total taxable value of land and additions on the property. | Land | Improvement |
|---|---|---|---|---|
| 2024 | $65 | $2,880 | $2,880 | $0 |
| 2023 | $65 | $3,200 | $3,200 | $0 |
| 2022 | $77 | $3,200 | $3,200 | $0 |
| 2021 | $79 | $3,200 | $3,200 | $0 |
| 2020 | $50 | $2,000 | $2,000 | $0 |
| 2019 | $50 | $2,000 | $2,000 | $0 |
| 2018 | $51 | $2,000 | $2,000 | $0 |
| 2017 | $382 | $3,348 | $2,200 | $1,148 |
| 2016 | $382 | $3,348 | $2,200 | $1,148 |
| 2015 | $383 | $3,348 | $2,200 | $1,148 |
| 2014 | $388 | $3,540 | $2,200 | $1,340 |
Source: Public Records
Map
Nearby Homes
- 175 Kings Way
- 12010 Highway 280 E
- 101 Shimmering Dell Dr
- 535 & 565 Deer Run Rd
- 218 Ridge Rd
- 141 Otter Way
- 0 Sand Hill Rd Unit 22392317
- 0 Sand Hill Rd Unit 325134
- 116 Cherokee Dr
- 2345 Eldora Rd
- 203 Cypress Lakes Dr
- 2391 Homestead Dr
- 444 Harvey Rd
- 227 Pebblestone Dr
- 223 Pebblestone Dr
- 1530 Olive Branch Rd
- 100 Sandstone Dr
- 1560 Olive Branch Rd
- 1800 Olive Branch Rd
- 511 Cobblestone Cir
- 121 Newman Rd
- 155 Newman Rd
- 118 Jarrell Rd
- 199 Newman Rd
- 79 Newman Rd
- 138 Jarrell Rd
- 100 Jarrell Rd
- 59 Newman Rd
- 202 Jarrell Rd
- 5364 Us Highway 80 E
- 5294 U S 80
- 5324 U S 80
- 226 Power Circle Rd
- 5324 Highway 80 E
- 5294 Us Highway 80 E
- 5324 Us 80 Hwy E
- 5324 Us Highway 80 E
- 300 Jarrell Rd
- 5394 Us Highway 80 E
- 163 Jarrell Rd