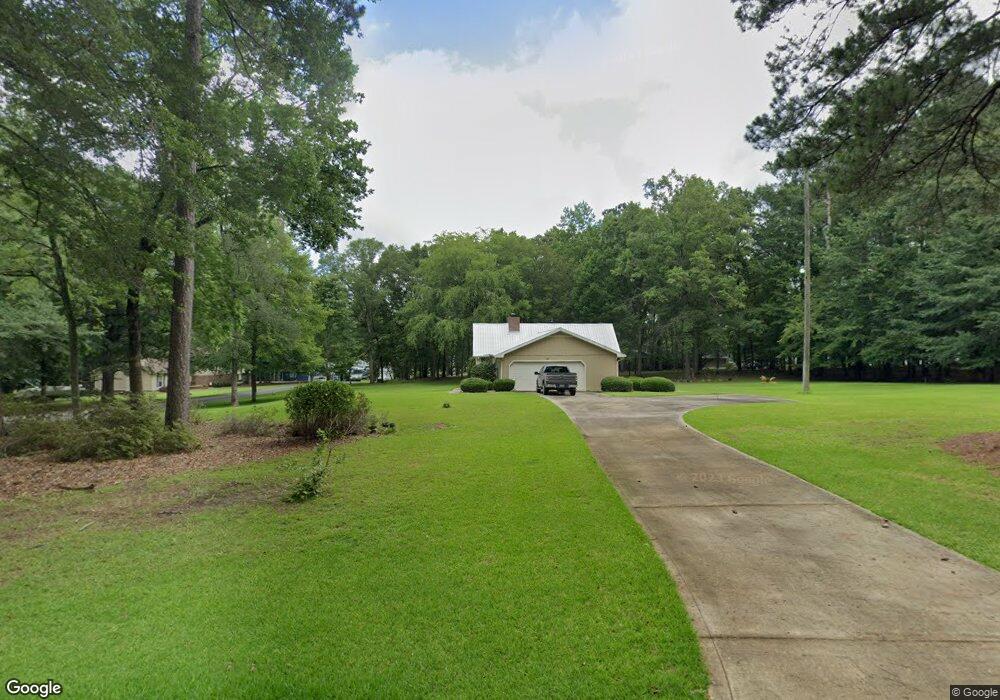
139 Oak Leaf Cir Unit 83 & 84 Eatonton, GA 31024
Estimated Value: $346,813 - $498,000
3
Beds
2
Baths
1,716
Sq Ft
$234/Sq Ft
Est. Value
About This Home
This home is located at 139 Oak Leaf Cir Unit 83 & 84, Eatonton, GA 31024 and is currently estimated at $401,203, approximately $233 per square foot. 139 Oak Leaf Cir Unit 83 & 84 is a home located in Putnam County with nearby schools including Putnam County Primary School, Putnam County Elementary School, and Putnam County Middle School.
Ownership History
Date
Name
Owned For
Owner Type
Purchase Details
Closed on
Oct 9, 2020
Sold by
Harris David L
Bought by
Brock Gerry S
Current Estimated Value
Home Financials for this Owner
Home Financials are based on the most recent Mortgage that was taken out on this home.
Original Mortgage
$182,000
Outstanding Balance
$161,584
Interest Rate
2.8%
Mortgage Type
New Conventional
Estimated Equity
$239,619
Purchase Details
Closed on
Aug 28, 2015
Sold by
Brookins Laney Allen
Bought by
Harris David L and Harris Georgia M
Home Financials for this Owner
Home Financials are based on the most recent Mortgage that was taken out on this home.
Original Mortgage
$128,000
Interest Rate
4.02%
Mortgage Type
New Conventional
Purchase Details
Closed on
Aug 3, 1993
Sold by
Davis L Melton
Bought by
Brookins Laney Allen
Purchase Details
Closed on
Jul 18, 1984
Sold by
Jenkins David L
Bought by
Davis L Melton
Create a Home Valuation Report for This Property
The Home Valuation Report is an in-depth analysis detailing your home's value as well as a comparison with similar homes in the area
Home Values in the Area
Average Home Value in this Area
Purchase History
| Date | Buyer | Sale Price | Title Company |
|---|---|---|---|
| Brock Gerry S | $234,000 | -- | |
| Harris David L | $160,000 | -- | |
| Brookins Laney Allen | $89,000 | -- | |
| Davis L Melton | -- | -- |
Source: Public Records
Mortgage History
| Date | Status | Borrower | Loan Amount |
|---|---|---|---|
| Open | Brock Gerry S | $182,000 | |
| Previous Owner | Harris David L | $128,000 |
Source: Public Records
Tax History Compared to Growth
Tax History
| Year | Tax Paid | Tax Assessment Tax Assessment Total Assessment is a certain percentage of the fair market value that is determined by local assessors to be the total taxable value of land and additions on the property. | Land | Improvement |
|---|---|---|---|---|
| 2024 | $1,253 | $113,657 | $9,600 | $104,057 |
| 2023 | $1,253 | $112,196 | $9,900 | $102,296 |
| 2022 | $1,408 | $116,162 | $18,000 | $98,162 |
| 2021 | $1,598 | $80,138 | $9,000 | $71,138 |
| 2020 | $1,461 | $60,322 | $7,800 | $52,522 |
| 2019 | $963 | $49,157 | $7,800 | $41,357 |
| 2018 | $978 | $59,346 | $7,800 | $51,546 |
| 2017 | $883 | $49,157 | $7,800 | $41,357 |
| 2016 | $884 | $49,157 | $7,800 | $41,357 |
| 2015 | $850 | $49,157 | $7,800 | $41,357 |
| 2014 | $849 | $49,157 | $7,800 | $41,357 |
Source: Public Records
Map
Nearby Homes
- 139 Oak Leaf Cir
- 105 Cedar Knob
- 138 Oak Leaf Cir
- 133 Oak Leaf Cir
- 85 Holly Ln
- 111 Holly Ln
- 100 Willow Cove
- 102 Holly Ln
- 106 Holly Ln
- 108 Cedar Knob
- 108 Holly Ln
- 31 Willow Cove
- 100 Spruce Point SE Unit 79
- 101 Spruce Point
- 104 Holly Ln
- 100 Spruce Point Unit 79
- 100 Spruce Point
- 0 Spruce Point SE Unit 3246572
- 0 Spruce Point SE Unit 79
- 0 Spruce Point