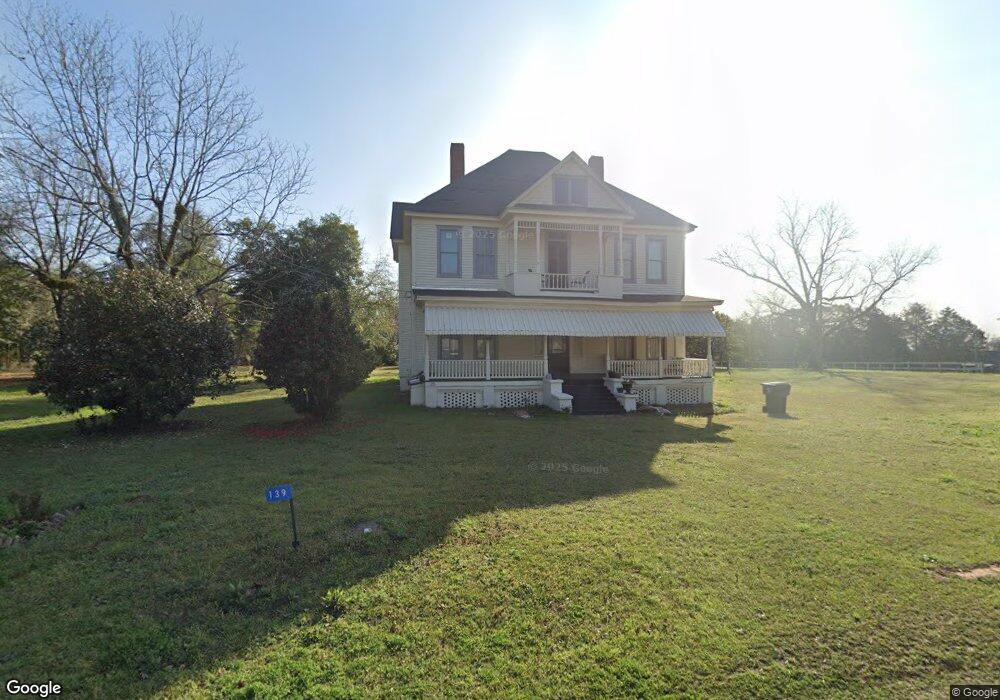
139 Old Chestnut St Unit o Lumpkin, GA 31815
Estimated Value: $62,000 - $180,000
6
Beds
2
Baths
3,706
Sq Ft
$26/Sq Ft
Est. Value
About This Home
This home is located at 139 Old Chestnut St Unit o, Lumpkin, GA 31815 and is currently estimated at $96,831, approximately $26 per square foot. 139 Old Chestnut St Unit o is a home located in Stewart County with nearby schools including Stewart County Elementary School, Stewart County Middle School, and Stewart County High School.
Ownership History
Date
Name
Owned For
Owner Type
Purchase Details
Closed on
Dec 1, 2022
Sold by
Winslow George
Bought by
Gabbidon Dechanne
Current Estimated Value
Purchase Details
Closed on
Sep 19, 2012
Sold by
Bank Of America
Bought by
Winslow George
Purchase Details
Closed on
Dec 15, 2011
Sold by
Federal Natiuonal Mtg Assn
Bought by
Bank Of America Na
Purchase Details
Closed on
Aug 2, 2011
Sold by
Bank Of America Na
Bought by
Federal National Mortgage Association
Purchase Details
Closed on
Mar 1, 2004
Sold by
Bank Of Dawson
Bought by
Grimmett Hall
Purchase Details
Closed on
Mar 24, 1993
Bought by
Bradshaw Stephen
Purchase Details
Closed on
Jul 26, 1988
Bought by
Whidden Ronnie M
Create a Home Valuation Report for This Property
The Home Valuation Report is an in-depth analysis detailing your home's value as well as a comparison with similar homes in the area
Home Values in the Area
Average Home Value in this Area
Purchase History
| Date | Buyer | Sale Price | Title Company |
|---|---|---|---|
| Gabbidon Dechanne | $60,000 | -- | |
| Winslow George | $11,500 | -- | |
| Bank Of America Na | -- | -- | |
| Federal National Mortgage Association | $102,800 | -- | |
| Grimmett Hall | $56,000 | -- | |
| Bradshaw Stephen | $36,000 | -- | |
| Whidden Ronnie M | $40,000 | -- |
Source: Public Records
Tax History Compared to Growth
Tax History
| Year | Tax Paid | Tax Assessment Tax Assessment Total Assessment is a certain percentage of the fair market value that is determined by local assessors to be the total taxable value of land and additions on the property. | Land | Improvement |
|---|---|---|---|---|
| 2024 | $925 | $20,720 | $3,280 | $17,440 |
| 2023 | $942 | $20,440 | $3,280 | $17,160 |
| 2022 | $441 | $16,560 | $3,280 | $13,280 |
| 2021 | $441 | $16,560 | $3,280 | $13,280 |
| 2020 | $442 | $16,560 | $3,280 | $13,280 |
| 2019 | $765 | $16,560 | $3,280 | $13,280 |
| 2018 | $442 | $16,560 | $3,280 | $13,280 |
| 2017 | $442 | $16,560 | $3,280 | $13,280 |
| 2016 | $441 | $16,560 | $3,280 | $13,280 |
| 2015 | -- | $16,560 | $3,280 | $13,280 |
| 2013 | -- | $20,360 | $3,280 | $17,080 |
Source: Public Records
Map
Nearby Homes
- 0 Rd
- 8 Old Chestnut St
- James Lane Loop
- James Lane Loop
- James Lane Loop
- 0 Humber Ave
- 0 House Ave
- Lumpkin Bypass Us Highway 27
- 0 Valley Rd
- 0 Liberty St Unit 10517245
- 0 Liberty St Unit 10517236
- 0 Thomas Rd
- 13990 Ga Highway 27
- 51 Forest Rd
- 0 Louise Bell Rd
- 0 Louise Bell Rd Unit 10536398
- 0 County Line Rd
- 0 Hwy 27 Highway 27
- 0 Canyon Rd
- 0 Moores Store Rd
- 139 Old Chestnut St
- 138 Old Chestnut St
- 170 Old Chestnut St
- 96 Old Chestnut St
- 434 Chestnut St
- 73 Old Chestnut St
- 118 Old Chestnut St
- 184 Old Chestnut St
- 70 Old Chestnut St
- 64 Stevens St
- 255 Old Chestnut St
- 98 Stevens St
- 216 Humber Ave
- 44 Old Chestnut St
- 50 Main St
- 190 Humber Ave
- 112 Stevens St
- 130 Main St
- 134 Stevens St
- 109 Parish St