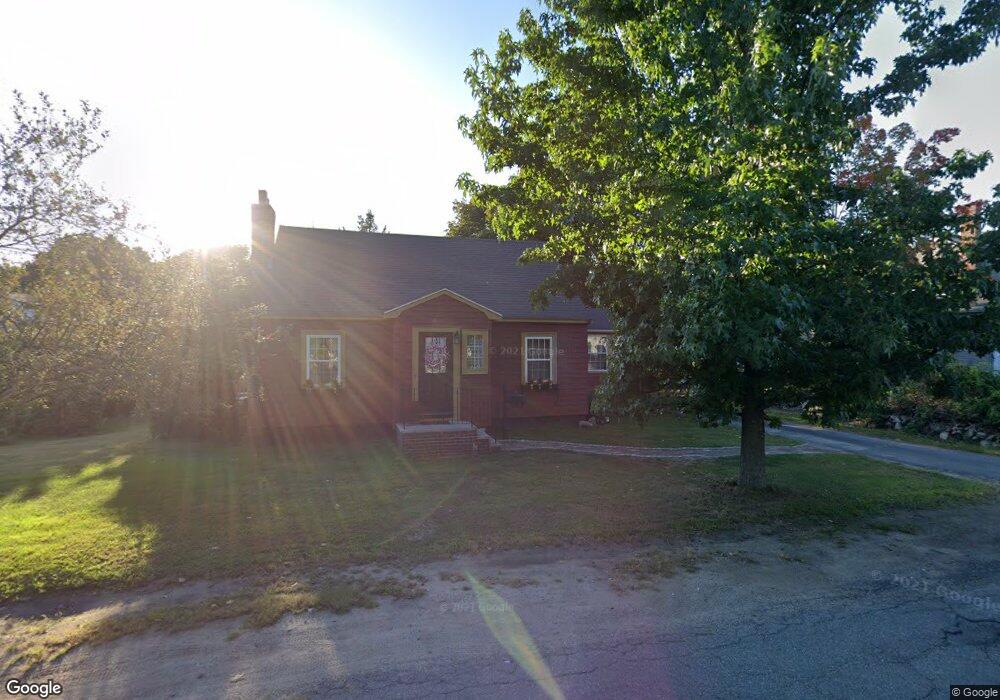
139 Park St Stoneham, MA 02180
Nobility Hill NeighborhoodEstimated Value: $652,000 - $724,000
3
Beds
2
Baths
1,260
Sq Ft
$541/Sq Ft
Est. Value
About This Home
This home is located at 139 Park St, Stoneham, MA 02180 and is currently estimated at $681,382, approximately $540 per square foot. 139 Park St is a home located in Middlesex County with nearby schools including Stoneham High School, St. Patrick Elementary School, and Greater Boston Academy.
Ownership History
Date
Name
Owned For
Owner Type
Purchase Details
Closed on
Sep 1, 1995
Sold by
Maclennan Arthur A and Maclennan Grace B
Bought by
Connell John M and Connell Marianne
Current Estimated Value
Home Financials for this Owner
Home Financials are based on the most recent Mortgage that was taken out on this home.
Original Mortgage
$142,600
Interest Rate
7.61%
Mortgage Type
Purchase Money Mortgage
Create a Home Valuation Report for This Property
The Home Valuation Report is an in-depth analysis detailing your home's value as well as a comparison with similar homes in the area
Home Values in the Area
Average Home Value in this Area
Purchase History
| Date | Buyer | Sale Price | Title Company |
|---|---|---|---|
| Connell John M | $155,000 | -- | |
| Connell John M | $155,000 | -- |
Source: Public Records
Mortgage History
| Date | Status | Borrower | Loan Amount |
|---|---|---|---|
| Open | Connell John M | $220,000 | |
| Closed | Connell John M | $142,000 | |
| Closed | Connell John M | $142,600 |
Source: Public Records
Tax History
| Year | Tax Paid | Tax Assessment Tax Assessment Total Assessment is a certain percentage of the fair market value that is determined by local assessors to be the total taxable value of land and additions on the property. | Land | Improvement |
|---|---|---|---|---|
| 2025 | $6,003 | $586,800 | $355,100 | $231,700 |
| 2024 | $5,745 | $542,500 | $327,000 | $215,500 |
| 2023 | $5,570 | $501,800 | $299,000 | $202,800 |
| 2022 | $4,810 | $462,100 | $271,000 | $191,100 |
| 2021 | $5,207 | $441,400 | $252,300 | $189,100 |
| 2020 | $4,595 | $425,900 | $239,500 | $186,400 |
| 2019 | $4,717 | $420,400 | $227,400 | $193,000 |
| 2018 | $4,615 | $394,100 | $202,700 | $191,400 |
| 2017 | $4,293 | $346,500 | $188,000 | $158,500 |
| 2016 | $4,338 | $341,600 | $188,000 | $153,600 |
| 2015 | $4,023 | $310,400 | $170,100 | $140,300 |
| 2014 | $3,743 | $277,500 | $143,200 | $134,300 |
Source: Public Records
Map
Nearby Homes
- 6 Everett St
- 57 Park St
- 2 Mason Way Unit 6524
- 6 Mason Way Unit 6324
- 6 Stratton Dr Unit 307
- 6 Stratton Dr Unit 208
- 6 Stratton Dr Unit 303
- 200 Ledgewood Dr Unit 601
- 8 Common St Unit 3
- 10 Pomeworth St Unit A
- 137 Franklin St Unit 102
- 17 Franklin St
- 18 Central St
- 1 Tremont St
- 21 Tremont St Unit B
- 21 Tremont St Unit A
- 159 Franklin St Unit D2
- 159 Franklin St Unit C2
- 159 Franklin St Unit E6
- 1 Alden Ave
Your Personal Tour Guide
Ask me questions while you tour the home.