
139 Pine St Unit 1/F Quincy, MA 02170
West Quincy NeighborhoodHighlights
- Property is near public transit
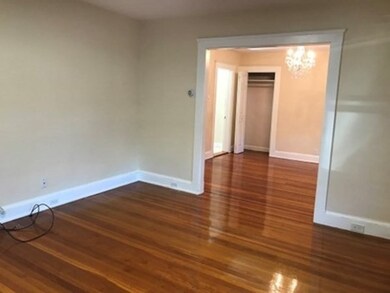
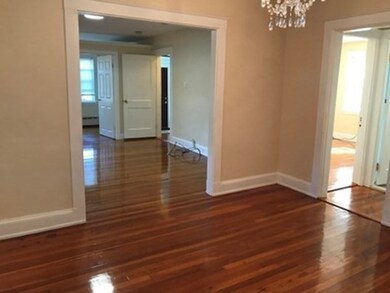
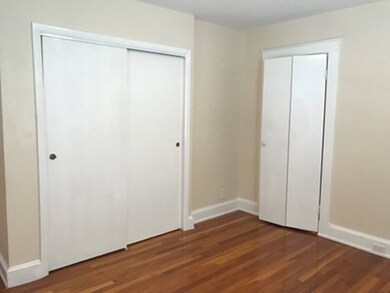
- Wood Flooring
- No HOA
- Central Middle School Rated A-
- Main Floor Primary Bedroom
- Jogging Path
About This Home
Located at 139 Pine Street,1/F, in the charming city of Quincy, Massachusetts, this residential property offers a unique opportunity to own a piece of New England history. This home stands as a testament to enduring craftsmanship. With 1250 square feet of living area, the layout provides a comfortable environment, ideal for both relaxation and everyday living. The three bedrooms offer personal space, allowing for flexible arrangements to suit a variety of needs. Imagine creating tranquil retreats within these rooms, each designed to reflect individual tastes and preferences. This residence provides ample space to create the home of your dreams and promises a unique living experience. The property features one full bathroom. This 1st-floor residence offers a harmonious combination of classic charm and practical living.
Property Details
Home Type
- Multi-Family
Est. Annual Taxes
- $10,633
Year Built
- Built in 1920
Home Design
- Apartment
- Entry on the 1st floor
Interior Spaces
- 1,250 Sq Ft Home
- Laundry in Basement
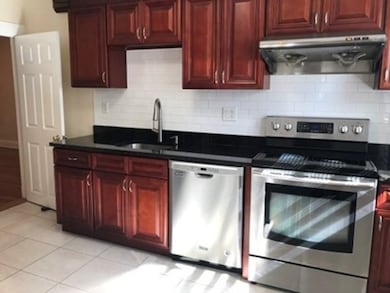
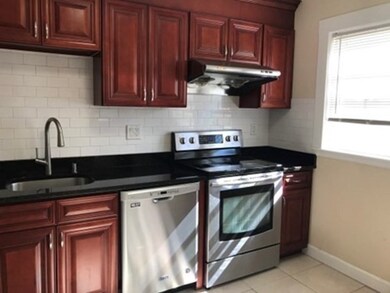
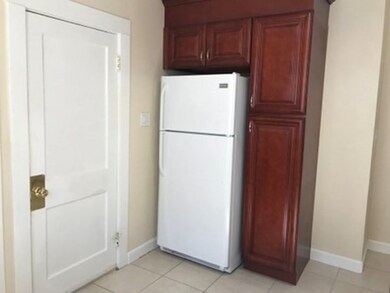
Kitchen
- Range with Range Hood
- Dishwasher
Flooring
- Wood
- Ceramic Tile
Bedrooms and Bathrooms
- 3 Bedrooms
- Primary Bedroom on Main
- 1 Full Bathroom
- Bathtub with Shower
Schools
- Wollaston Elementary School
- Central Middle School
- N. Quincy High School
Utilities
- No Cooling
- Heating System Uses Natural Gas
Additional Features
- 9,999 Sq Ft Lot
- Property is near public transit
Listing and Financial Details
- Security Deposit $2,600
- Rent includes water
- Assessor Parcel Number 189075
Community Details
Recreation
- Park
- Jogging Path
Pet Policy
- No Pets Allowed
Additional Features
- No Home Owners Association
- Laundry Facilities
Map
Source: MLS Property Information Network (MLS PIN)
MLS Number: 73458593
APN: QUIN-005151-000012-000019
Disclaimer: Certain information contained herein is derived from information provided by parties other than Homes.com. All information provided is deemed reliable, but is not guaranteed to be accurate and should be independently verified.
![]() The property listing data and information, or the Images, set forth herein were provided to MLS Property Information Network, Inc. from third party sources, including sellers, lessors and public records, and were compiled by MLS Property Information Network, Inc. The property listing data and information, and the Images, are for the personal, non-commercial use of consumers having a good faith interest in purchasing or leasing listed properties of the type displayed to them and may not be used for any purpose other than to identify prospective properties which such consumers may have a good faith interest in purchasing or leasing. MLS Property Information Network, Inc. and its subscribers disclaim any and all representations and warranties as to the accuracy of the property listing data and information, or as to the accuracy of any of the Images, set forth herein.
The property listing data and information, or the Images, set forth herein were provided to MLS Property Information Network, Inc. from third party sources, including sellers, lessors and public records, and were compiled by MLS Property Information Network, Inc. The property listing data and information, and the Images, are for the personal, non-commercial use of consumers having a good faith interest in purchasing or leasing listed properties of the type displayed to them and may not be used for any purpose other than to identify prospective properties which such consumers may have a good faith interest in purchasing or leasing. MLS Property Information Network, Inc. and its subscribers disclaim any and all representations and warranties as to the accuracy of the property listing data and information, or as to the accuracy of any of the Images, set forth herein.
- 129-131 Pine St
- 121 Hillside Ave
- 171 Milton St
- 11 Rockwell Ave
- 323 Farrington St
- 45 Marion St
- 204 Farrington St
- 129 Beale St
- 143 Arlington St
- 10 White St
- 60 Pond St
- 41 Wallace Rd
- 365 Newport Ave Unit 301
- 51 Denmark Ave
- 100 Grandview Ave Unit 11A
- 111 Warren Ave Unit 1F
- 73 Connell St
- 89 Puritan Dr
- 465 Newport Ave
- 522 Hancock St
- 151 Pine St Unit 2
- 60 Exeter St Unit 2
- 115 Everett St Unit 1
- 17 Albany St Unit 1
- 30 Elmwood Park Unit 2
- 5 Bishop Rd Unit 4
- 65 Elmwood Park
- 36 Hillside Ave Unit 2
- 130 Taylor St
- 289 Highland Ave Unit 1L
- 88 Elmwood Ave Unit 1
- 80 Brook St Unit 2
- 40 Hilda St Unit 2
- 125 Lincoln Ave Unit 1
- 83 Forbes Hill Rd Unit 1
- 221 S Central Ave
- 66 Brook St Unit 1
- 66 Brook St Unit 2
- 29 Washington St Unit 2
- 107 Lincoln Ave Unit 2
