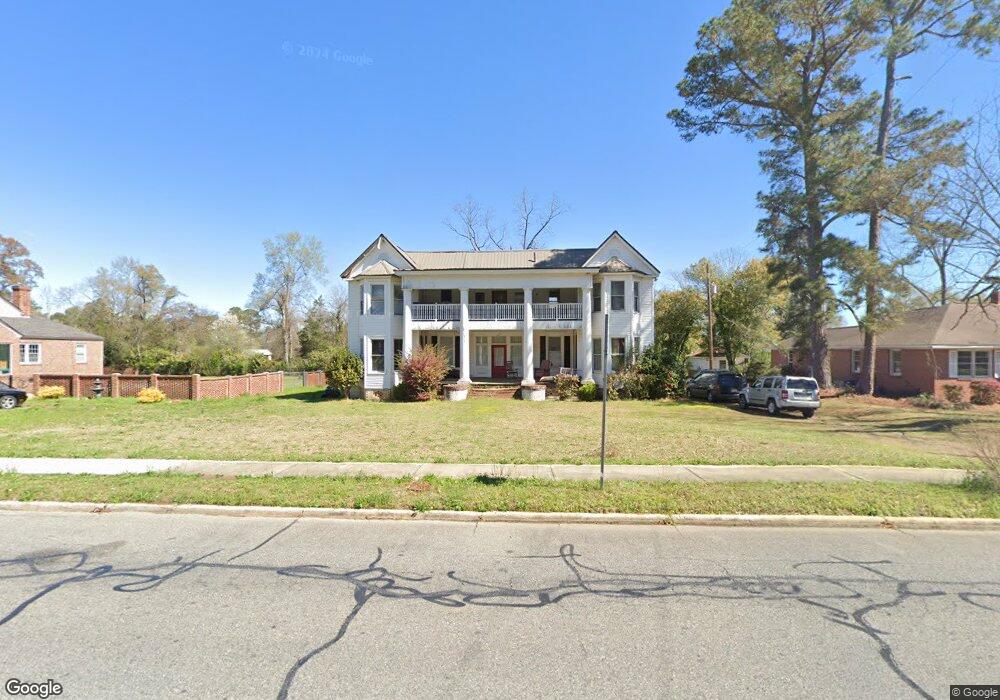
139 S 2nd St Cochran, GA 31014
Estimated Value: $276,000 - $331,665
4
Beds
3
Baths
4,205
Sq Ft
$71/Sq Ft
Est. Value
About This Home
This home is located at 139 S 2nd St, Cochran, GA 31014 and is currently estimated at $298,666, approximately $71 per square foot. 139 S 2nd St is a home located in Bleckley County with nearby schools including Bleckley County Primary School, Bleckley County Elementary School, and Bleckley Middle School.
Ownership History
Date
Name
Owned For
Owner Type
Purchase Details
Closed on
Nov 12, 2004
Sold by
Parks Linda J
Bought by
Parks Roger D
Current Estimated Value
Purchase Details
Closed on
Nov 21, 2003
Sold by
Bryan John S
Bought by
Parks Roger D
Purchase Details
Closed on
Sep 19, 2000
Sold by
Bryan John S
Bought by
Bryan John S
Purchase Details
Closed on
Jun 1, 2000
Sold by
Altegra Credit Compa
Bought by
Bryan John S
Purchase Details
Closed on
Mar 7, 2000
Sold by
Cipolia Thomas J
Bought by
Altegra Credit Compa
Purchase Details
Closed on
Jan 22, 1997
Sold by
Mathews Eleanor U
Bought by
Cipolia Thomas J
Purchase Details
Closed on
Aug 12, 1996
Sold by
Thomas Charles Rona
Bought by
Mathews Eleanor U
Create a Home Valuation Report for This Property
The Home Valuation Report is an in-depth analysis detailing your home's value as well as a comparison with similar homes in the area
Home Values in the Area
Average Home Value in this Area
Purchase History
| Date | Buyer | Sale Price | Title Company |
|---|---|---|---|
| Parks Roger D | -- | -- | |
| Parks Roger D | $154,000 | -- | |
| Bryan John S | -- | -- | |
| Bryan John S | $111,000 | -- | |
| Altegra Credit Compa | $106,000 | -- | |
| Cipolia Thomas J | $95,500 | -- | |
| Mathews Eleanor U | -- | -- |
Source: Public Records
Tax History Compared to Growth
Tax History
| Year | Tax Paid | Tax Assessment Tax Assessment Total Assessment is a certain percentage of the fair market value that is determined by local assessors to be the total taxable value of land and additions on the property. | Land | Improvement |
|---|---|---|---|---|
| 2024 | $4,236 | $113,840 | $5,280 | $108,560 |
| 2023 | $4,596 | $113,840 | $5,280 | $108,560 |
| 2022 | $2,688 | $100,800 | $5,280 | $95,520 |
| 2021 | $2,127 | $76,880 | $5,280 | $71,600 |
| 2020 | $2,135 | $76,880 | $5,280 | $71,600 |
| 2019 | $1,240 | $45,466 | $7,200 | $38,266 |
| 2018 | $1,838 | $45,466 | $7,200 | $38,266 |
| 2017 | $1,255 | $45,466 | $7,200 | $38,266 |
| 2016 | $1,268 | $45,466 | $7,200 | $38,266 |
| 2015 | -- | $45,466 | $7,200 | $38,266 |
| 2014 | -- | $45,466 | $7,200 | $38,266 |
| 2013 | -- | $45,466 | $7,200 | $38,266 |
Source: Public Records
Map
Nearby Homes
- 142 Rose St
- 119 S 4th St
- 1277 Georgia 112
- 118 S 5th St
- 123 S 5th St
- 0 Tiffany Dr Unit 10525322
- 115 Plantation Dr
- 134 Easy St
- 112 Pecan St
- 118 Pecan St
- 116 Pecan St
- 140 Racetrack Dr
- 0 Willow Creek Run
- 116 Jackson St
- 151 N 7th St
- 105 Hillcrest Dr
- 157 10th St SE
- 260 Ann St
- 264 Ann St
- RV Park Mac Thompson Rd