Estimated Value: $302,000 - $450,000
4
Beds
2
Baths
2,132
Sq Ft
$177/Sq Ft
Est. Value
About This Home
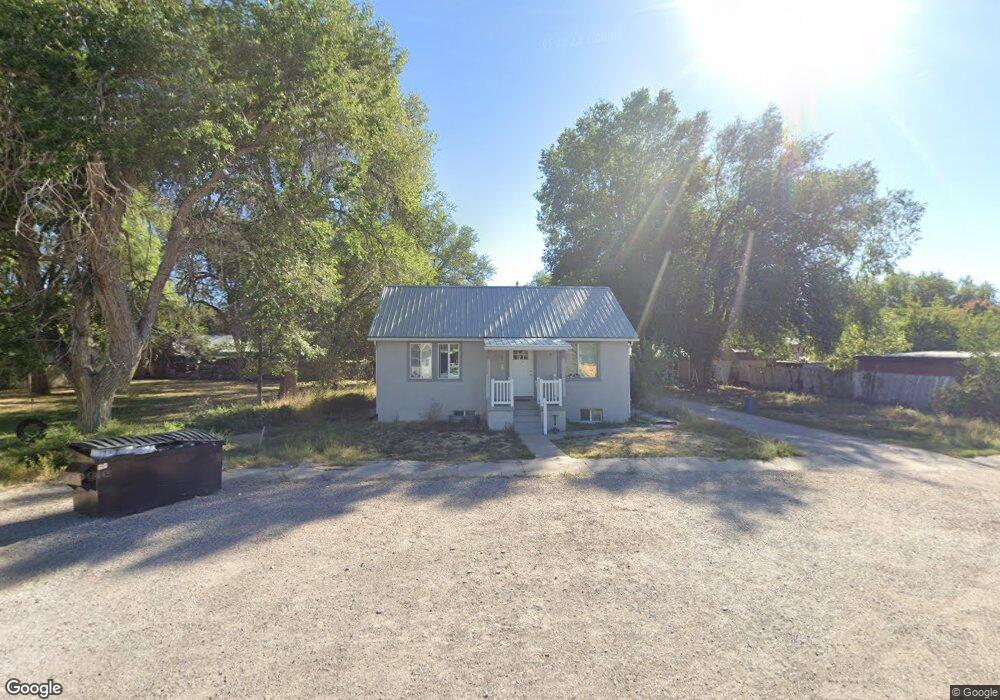
This home is located at 139 S 400 W, Delta, UT 84624 and is currently estimated at $376,956, approximately $176 per square foot. 139 S 400 W is a home located in Millard County with nearby schools including Cba Center and White River Academy.
Ownership History
Date
Name
Owned For
Owner Type
Purchase Details
Closed on
Apr 2, 2025
Sold by
Aliaga Regulo Lapa
Bought by
Hurtado Martin and Ortiz Anna Lucia
Current Estimated Value
Home Financials for this Owner
Home Financials are based on the most recent Mortgage that was taken out on this home.
Original Mortgage
$20,737
Outstanding Balance
$20,612
Interest Rate
6.85%
Estimated Equity
$356,344
Purchase Details
Closed on
Apr 25, 2023
Sold by
Central Bank
Bought by
Aliaga Regulo Lapa
Home Financials for this Owner
Home Financials are based on the most recent Mortgage that was taken out on this home.
Original Mortgage
$262,774
Interest Rate
6.6%
Mortgage Type
New Conventional
Purchase Details
Closed on
Dec 9, 2014
Sold by
Dana R Dana R
Bought by
Central Bank Custodian Fbo Jason Charlie
Create a Home Valuation Report for This Property
The Home Valuation Report is an in-depth analysis detailing your home's value as well as a comparison with similar homes in the area
Home Values in the Area
Average Home Value in this Area
Purchase History
| Date | Buyer | Sale Price | Title Company |
|---|---|---|---|
| Hurtado Martin | -- | Fidelity National Title | |
| Hurtado Martin | -- | Fidelity National Title | |
| Aliaga Regulo Lapa | -- | First American Title Insurance | |
| Central Bank Custodian Fbo Jason Charlie | -- | First American Title Insur |
Source: Public Records
Mortgage History
| Date | Status | Borrower | Loan Amount |
|---|---|---|---|
| Open | Hurtado Martin | $20,737 | |
| Closed | Hurtado Martin | $20,737 | |
| Open | Hurtado Martin | $345,624 | |
| Closed | Hurtado Martin | $345,624 | |
| Previous Owner | Aliaga Regulo Lapa | $262,774 |
Source: Public Records
Tax History Compared to Growth
Tax History
| Year | Tax Paid | Tax Assessment Tax Assessment Total Assessment is a certain percentage of the fair market value that is determined by local assessors to be the total taxable value of land and additions on the property. | Land | Improvement |
|---|---|---|---|---|
| 2025 | $2,646 | $283,108 | $16,546 | $266,562 |
| 2024 | $2,646 | $120,052 | $12,403 | $107,649 |
| 2023 | $1,500 | $120,052 | $12,403 | $107,649 |
| 2022 | $1,003 | $75,412 | $12,967 | $62,445 |
| 2021 | $847 | $60,781 | $9,805 | $50,976 |
| 2020 | $788 | $56,172 | $8,913 | $47,259 |
| 2019 | $689 | $49,161 | $8,268 | $40,893 |
| 2018 | $637 | $45,784 | $8,268 | $37,516 |
| 2017 | $657 | $45,543 | $8,027 | $37,516 |
| 2016 | $636 | $45,543 | $8,027 | $37,516 |
| 2015 | $636 | $45,543 | $8,027 | $37,516 |
| 2014 | -- | $42,312 | $8,027 | $34,285 |
| 2013 | -- | $42,312 | $8,027 | $34,285 |
Source: Public Records
Map
Nearby Homes
- 435 W 100 S
- 242 S 400 W
- 294 S 300 W
- 163 W 100 S
- 331 W 200 N
- 185 N 200 W
- 451 W 300 N
- 328 S Center St
- 32 E 300 S
- 38 E 300 S
- 325 N 100 W
- 0 E Highway 6 Unit LotWP001 16586023
- 44 E 300 S
- 321 E 200 S
- 445 Topaz Blvd Unit 10
- 461 Topaz Blvd Unit 6
- 7900 E 250 Rd N
- 625 E Birch Dr
- 98 W 1000 N
- 665 Bristlecone Ln