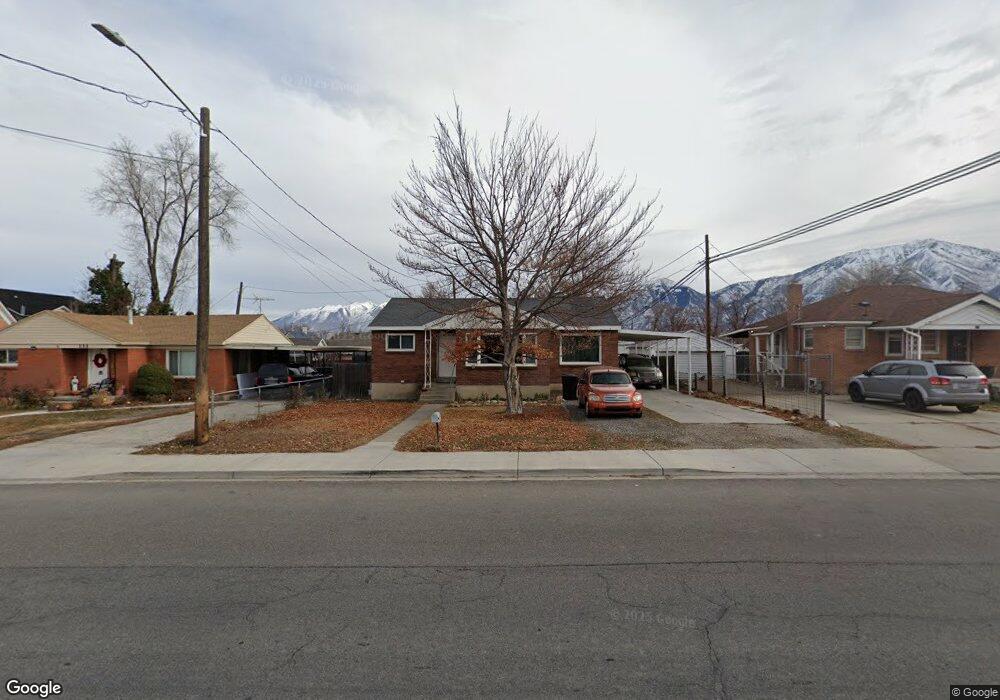
139 S 600 E Payson, UT 84651
Estimated Value: $410,000 - $456,000
4
Beds
2
Baths
2,164
Sq Ft
$198/Sq Ft
Est. Value
About This Home
This home is located at 139 S 600 E, Payson, UT 84651 and is currently estimated at $428,782, approximately $198 per square foot. 139 S 600 E is a home located in Utah County with nearby schools including Barnett Elementary School, Salem Junior High School, and Valley View Middle School.
Ownership History
Date
Name
Owned For
Owner Type
Purchase Details
Closed on
Feb 26, 2009
Sold by
Westling David P and Westling Carolyn
Bought by
Sorenson Blake and Sorenson Cheryl
Current Estimated Value
Home Financials for this Owner
Home Financials are based on the most recent Mortgage that was taken out on this home.
Original Mortgage
$152,192
Outstanding Balance
$95,639
Interest Rate
4.91%
Mortgage Type
FHA
Estimated Equity
$333,143
Purchase Details
Closed on
Jul 3, 2002
Sold by
Dally Quentin V and Dally Rebecca L
Bought by
Westling David P and Westling Carolyn
Home Financials for this Owner
Home Financials are based on the most recent Mortgage that was taken out on this home.
Original Mortgage
$122,674
Interest Rate
6.71%
Mortgage Type
FHA
Purchase Details
Closed on
Aug 25, 1997
Sold by
Christensen Derek Blair and Christensen Sherie Kay
Bought by
Dally Quentin V and Dally Rebecca L
Home Financials for this Owner
Home Financials are based on the most recent Mortgage that was taken out on this home.
Original Mortgage
$103,050
Interest Rate
7.43%
Create a Home Valuation Report for This Property
The Home Valuation Report is an in-depth analysis detailing your home's value as well as a comparison with similar homes in the area
Home Values in the Area
Average Home Value in this Area
Purchase History
| Date | Buyer | Sale Price | Title Company |
|---|---|---|---|
| Sorenson Blake | -- | Inwest Title Services Inc | |
| Westling David P | -- | Provo Land Title Company | |
| Dally Quentin V | -- | First American Title |
Source: Public Records
Mortgage History
| Date | Status | Borrower | Loan Amount |
|---|---|---|---|
| Open | Sorenson Blake | $152,192 | |
| Previous Owner | Westling David P | $122,674 | |
| Previous Owner | Dally Quentin V | $103,050 | |
| Closed | Westling David P | $4,736 |
Source: Public Records
Tax History
| Year | Tax Paid | Tax Assessment Tax Assessment Total Assessment is a certain percentage of the fair market value that is determined by local assessors to be the total taxable value of land and additions on the property. | Land | Improvement |
|---|---|---|---|---|
| 2025 | $1,906 | $208,725 | -- | -- |
| 2024 | $1,906 | $193,985 | $0 | $0 |
| 2023 | $1,918 | $195,745 | $0 | $0 |
| 2022 | $2,045 | $205,260 | $0 | $0 |
| 2021 | $1,696 | $273,000 | $85,500 | $187,500 |
| 2020 | $1,618 | $254,900 | $77,700 | $177,200 |
| 2019 | $1,399 | $225,900 | $67,100 | $158,800 |
| 2018 | $1,274 | $198,300 | $56,500 | $141,800 |
| 2017 | $1,168 | $97,735 | $0 | $0 |
| 2016 | $1,072 | $89,155 | $0 | $0 |
| 2015 | $1,027 | $84,810 | $0 | $0 |
| 2014 | $920 | $76,560 | $0 | $0 |
Source: Public Records
Map
Nearby Homes
Your Personal Tour Guide
Ask me questions while you tour the home.