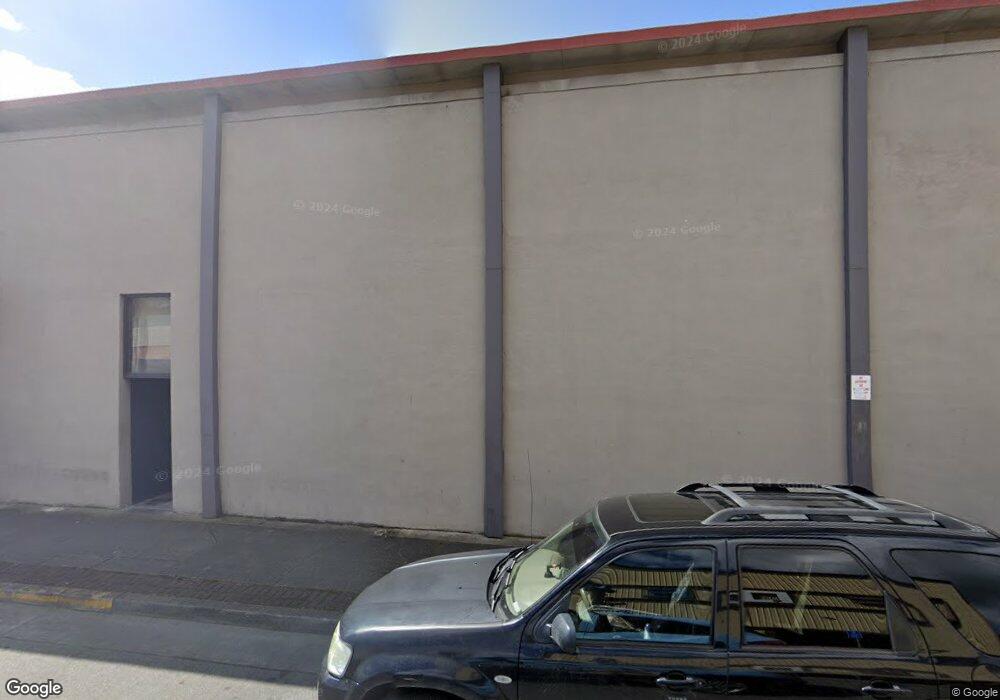
139 SE J St Grants Pass, OR 97526
--
Bed
--
Bath
22,085
Sq Ft
1.52
Acres
About This Home
This home is located at 139 SE J St, Grants Pass, OR 97526. 139 SE J St is a home located in Josephine County with nearby schools including Riverside Elementary School, South Middle School, and Grants Pass High School.
Ownership History
Date
Name
Owned For
Owner Type
Purchase Details
Closed on
Jun 28, 2023
Sold by
Brutke Properties Llc
Bought by
Community Library Properties Llc
Purchase Details
Closed on
May 28, 2008
Sold by
Thomason Investment Properties Llc
Bought by
Brutke Properties Llc
Home Financials for this Owner
Home Financials are based on the most recent Mortgage that was taken out on this home.
Original Mortgage
$1,898,219
Interest Rate
5.87%
Mortgage Type
Commercial
Purchase Details
Closed on
Feb 8, 2007
Sold by
Brutke Robert W and Brutke Vickie J
Bought by
Thomason Investment Properties Llc
Create a Home Valuation Report for This Property
The Home Valuation Report is an in-depth analysis detailing your home's value as well as a comparison with similar homes in the area
Home Values in the Area
Average Home Value in this Area
Purchase History
| Date | Buyer | Sale Price | Title Company |
|---|---|---|---|
| Community Library Properties Llc | $1,925,000 | First American Title | |
| Brutke Properties Llc | $1,875,000 | Multiple | |
| Thomason Investment Properties Llc | -- | None Available | |
| Thomason Investment Properties Llc | -- | None Available |
Source: Public Records
Mortgage History
| Date | Status | Borrower | Loan Amount |
|---|---|---|---|
| Previous Owner | Brutke Properties Llc | $1,898,219 |
Source: Public Records
Tax History Compared to Growth
Tax History
| Year | Tax Paid | Tax Assessment Tax Assessment Total Assessment is a certain percentage of the fair market value that is determined by local assessors to be the total taxable value of land and additions on the property. | Land | Improvement |
|---|---|---|---|---|
| 2025 | $14,795 | $1,108,350 | $428,670 | $679,680 |
| 2024 | $14,795 | $1,108,350 | $428,670 | $679,680 |
| 2023 | $15,113 | $1,171,590 | $424,670 | $746,920 |
| 2022 | $15,153 | $1,171,370 | $420,840 | $750,530 |
| 2021 | $16,360 | $1,272,590 | $0 | $0 |
| 2020 | $16,055 | $1,235,530 | $0 | $0 |
| 2019 | $15,315 | $1,199,550 | $0 | $0 |
| 2018 | $16,025 | $1,199,550 | $0 | $0 |
| 2017 | $16,364 | $1,199,550 | $0 | $0 |
| 2016 | $14,618 | $1,196,430 | $0 | $0 |
| 2015 | $14,558 | $1,195,650 | $0 | $0 |
| 2014 | $14,333 | $1,160,830 | $0 | $0 |
Source: Public Records
Map
Nearby Homes
- 139 SW I St
- 409 SE J St
- 702 SE 9th St
- 415 SE J St
- 303 SW I St
- 330 SW K St
- 710 SE 12th St
- 708 SW Bridge St
- 711 SE Riverside Ave
- 619 SE M St
- 205 SW Booth St
- 419 NW D St
- 253 SW Central Ave
- 508 NW E St Unit A,B,C
- 419 NW C St
- 737 SE M St
- 207 SW Oak St
- 927 SW L St
- 11311133 SW Central Ave
- 115 Rogue River Hwy Unit 302