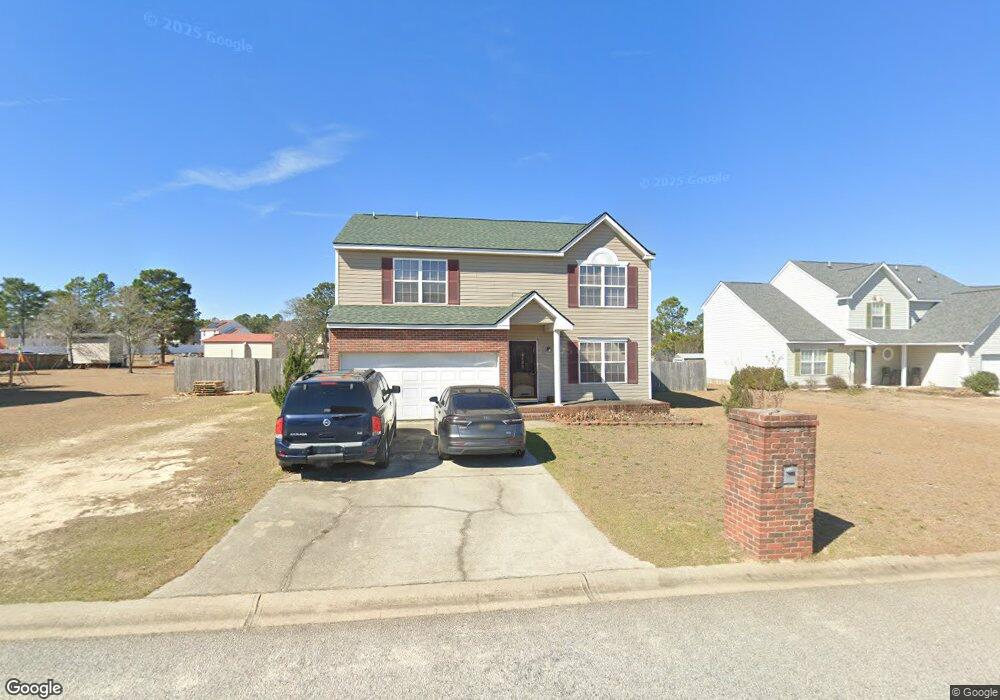
139 Shawnmoor Ln Gaston, SC 29053
Estimated Value: $246,000 - $283,000
5
Beds
3
Baths
2,448
Sq Ft
$108/Sq Ft
Est. Value
About This Home
This home is located at 139 Shawnmoor Ln, Gaston, SC 29053 and is currently estimated at $263,494, approximately $107 per square foot. 139 Shawnmoor Ln is a home located in Lexington County with nearby schools including Herbert A. Wood Elementary School, Pine Ridge Middle School, and Airport High School.
Ownership History
Date
Name
Owned For
Owner Type
Purchase Details
Closed on
Jan 28, 2014
Sold by
Branch Banking & Trust Company
Bought by
Hough Andre
Current Estimated Value
Home Financials for this Owner
Home Financials are based on the most recent Mortgage that was taken out on this home.
Original Mortgage
$88,673
Outstanding Balance
$67,447
Interest Rate
4.51%
Mortgage Type
Future Advance Clause Open End Mortgage
Estimated Equity
$196,047
Purchase Details
Closed on
Sep 20, 2013
Sold by
Lendmark Financial Services Inc
Bought by
Branch Banking & Trust Company
Purchase Details
Closed on
Jun 17, 2013
Sold by
Brown Tony and Brown Yvonne
Bought by
Lendmark Financial Services Inc
Purchase Details
Closed on
Oct 31, 2005
Sold by
Nvr Rymarc Homes Of South Carolina Llc
Bought by
Brown Tony and Brown Yvonnie
Home Financials for this Owner
Home Financials are based on the most recent Mortgage that was taken out on this home.
Original Mortgage
$118,408
Interest Rate
9.5%
Mortgage Type
Adjustable Rate Mortgage/ARM
Create a Home Valuation Report for This Property
The Home Valuation Report is an in-depth analysis detailing your home's value as well as a comparison with similar homes in the area
Home Values in the Area
Average Home Value in this Area
Purchase History
| Date | Buyer | Sale Price | Title Company |
|---|---|---|---|
| Hough Andre | $86,900 | -- | |
| Branch Banking & Trust Company | -- | -- | |
| Lendmark Financial Services Inc | $90,000 | -- | |
| Brown Tony | $124,640 | -- |
Source: Public Records
Mortgage History
| Date | Status | Borrower | Loan Amount |
|---|---|---|---|
| Open | Hough Andre | $88,673 | |
| Previous Owner | Brown Tony | $118,408 |
Source: Public Records
Tax History Compared to Growth
Tax History
| Year | Tax Paid | Tax Assessment Tax Assessment Total Assessment is a certain percentage of the fair market value that is determined by local assessors to be the total taxable value of land and additions on the property. | Land | Improvement |
|---|---|---|---|---|
| 2024 | $758 | $5,352 | $1,109 | $4,243 |
| 2023 | $758 | $5,352 | $1,109 | $4,243 |
| 2020 | $754 | $5,352 | $1,109 | $4,243 |
| 2019 | $669 | $4,654 | $880 | $3,774 |
| 2018 | $679 | $4,654 | $880 | $3,774 |
| 2017 | $653 | $4,654 | $880 | $3,774 |
| 2016 | $671 | $4,654 | $880 | $3,774 |
| 2014 | $503 | $5,101 | $880 | $4,221 |
| 2013 | -- | $5,100 | $880 | $4,220 |
Source: Public Records
Map
Nearby Homes
- 272 Woodcote Dr
- 172 Heather Ridge Dr
- 120 Heather Ridge Dr
- 132 Heather Ridge Dr
- 111 Allenvalley Rd
- 0 Highway 321
- Dickenson Plan at The Village at Glenn Hills
- Crane Plan at The Village at Glenn Hills
- Frost Plan at The Village at Glenn Hills
- Anderson Plan at The Village at Glenn Hills
- Emerson Plan at The Village at Glenn Hills
- Oakmont Plan at The Village at Glenn Hills
- 341 Wayne St
- 811 Nilo Farms Way
- 816 Nilo Farms Way
- 808 Nilo Farms Way
- 331 Silver Spur Way
- 325 Silver Spur Way
- 847 Nilo Farms Way
- 602 Rustic Cabin Ln
- 135 Shawnmoor Ln
- 143 Shawnmoor Ln
- 147 Shawnmoor Ln
- 131 Shawnmoor Ln
- 151 Shawnmoor Ln
- 272 Edinfield Ct
- 136 Shawnmoor Ln
- 155 Shawnmoor Ln
- 132 Shawnmoor Ln
- 140 Shawnmoor Ln
- 268 Edinfield Ct
- 127 Shawnmoor Ln
- 264 Edinfield Ct
- 144 Shawnmoor Ln
- 276 Edinfield Ct
- 128 Shawnmoor Ln
- 123 Shawnmoor Ln
- 260 Edinfield Ct
- 124 Shawnmoor Ln
- 275 Edinfield Ct