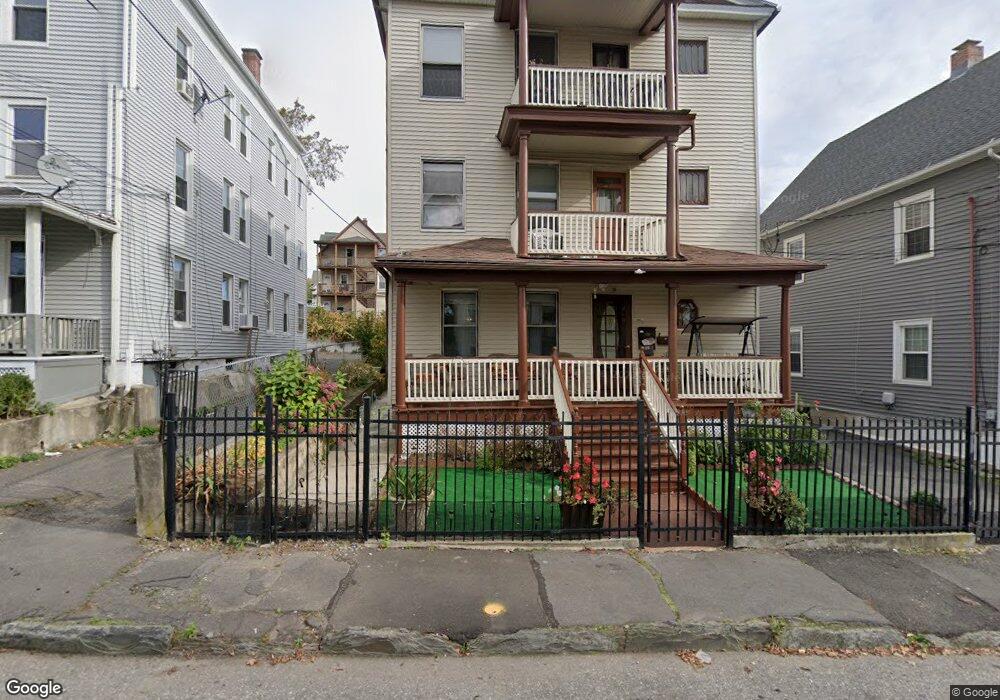
139 South St Waterbury, CT 06706
South End District NeighborhoodEstimated Value: $314,797 - $396,000
6
Beds
3
Baths
3,660
Sq Ft
$100/Sq Ft
Est. Value
About This Home
This home is located at 139 South St, Waterbury, CT 06706 and is currently estimated at $366,699, approximately $100 per square foot. 139 South St is a home located in New Haven County with nearby schools including Washington School, West Side Middle School, and Crosby High School.
Ownership History
Date
Name
Owned For
Owner Type
Purchase Details
Closed on
Jan 8, 1999
Sold by
Caisse Beatrice M
Bought by
Rodriguez Reynaldo and Torres Elsa
Current Estimated Value
Home Financials for this Owner
Home Financials are based on the most recent Mortgage that was taken out on this home.
Original Mortgage
$95,600
Interest Rate
6.8%
Mortgage Type
Purchase Money Mortgage
Create a Home Valuation Report for This Property
The Home Valuation Report is an in-depth analysis detailing your home's value as well as a comparison with similar homes in the area
Home Values in the Area
Average Home Value in this Area
Purchase History
| Date | Buyer | Sale Price | Title Company |
|---|---|---|---|
| Rodriguez Reynaldo | $98,500 | -- |
Source: Public Records
Mortgage History
| Date | Status | Borrower | Loan Amount |
|---|---|---|---|
| Open | Rodriguez Reynaldo | $178,896 | |
| Closed | Rodriguez Reynaldo | $164,836 | |
| Closed | Rodriguez Reynaldo | $95,600 | |
| Previous Owner | Rodriguez Reynaldo | $30,000 | |
| Closed | Rodriguez Reynaldo | $4,400 |
Source: Public Records
Tax History Compared to Growth
Tax History
| Year | Tax Paid | Tax Assessment Tax Assessment Total Assessment is a certain percentage of the fair market value that is determined by local assessors to be the total taxable value of land and additions on the property. | Land | Improvement |
|---|---|---|---|---|
| 2025 | $6,338 | $140,910 | $13,020 | $127,890 |
| 2024 | $6,967 | $140,910 | $13,020 | $127,890 |
| 2023 | $7,636 | $140,910 | $13,020 | $127,890 |
| 2022 | $4,459 | $74,050 | $13,020 | $61,030 |
| 2021 | $4,459 | $74,050 | $13,020 | $61,030 |
| 2020 | $4,459 | $74,050 | $13,020 | $61,030 |
| 2019 | $4,459 | $74,050 | $13,020 | $61,030 |
| 2018 | $4,459 | $74,050 | $13,020 | $61,030 |
| 2017 | $4,527 | $75,190 | $13,020 | $62,170 |
| 2016 | $4,527 | $75,190 | $13,020 | $62,170 |
| 2015 | $4,378 | $75,190 | $13,020 | $62,170 |
| 2014 | $4,378 | $75,190 | $13,020 | $62,170 |
Source: Public Records
Map
Nearby Homes
- 127 Lounsbury St
- 41 Laval St
- 40 Laval St
- 915 S Main St
- 140 Edgewood Ave
- 146 Charles St
- 0372 Floyd St
- 41L Floyd St
- 0039 Floyd St
- 32 Ridge St
- 137 Greenmount Terrace
- 00 Milton Ave
- 381 Congress Ave
- 439 Piedmont St
- 51 Clover St
- 124 Geddes Terrace
- 318 Congress Ave
- 335 Raymond St
- 16 Clairmont Ave
- 430 Washington Ave