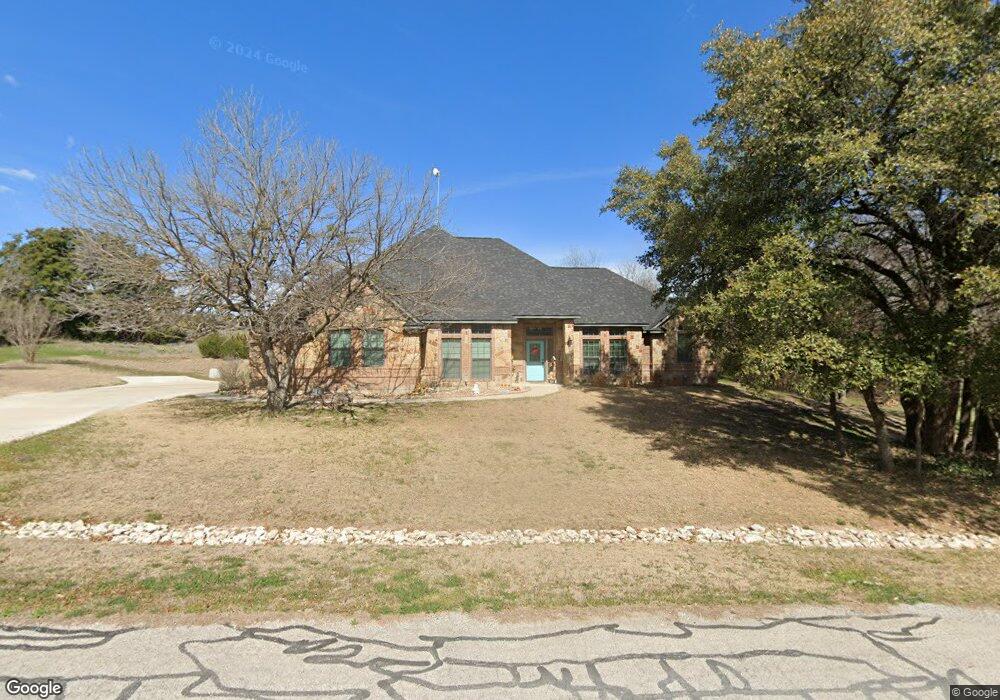
139 Tankersley Ln Weatherford, TX 76087
Estimated Value: $487,323 - $568,000
--
Bed
--
Bath
2,378
Sq Ft
$220/Sq Ft
Est. Value
About This Home
This home is located at 139 Tankersley Ln, Weatherford, TX 76087 and is currently estimated at $522,081, approximately $219 per square foot. 139 Tankersley Ln is a home with nearby schools including Austin Elementary School, Hall Middle School, and Weatherford High School.
Ownership History
Date
Name
Owned For
Owner Type
Purchase Details
Closed on
Nov 16, 2011
Sold by
Aledo Land Llc
Bought by
Hughes Stephen C and Hughes Sandra L
Current Estimated Value
Home Financials for this Owner
Home Financials are based on the most recent Mortgage that was taken out on this home.
Original Mortgage
$174,650
Outstanding Balance
$118,922
Interest Rate
3.99%
Mortgage Type
New Conventional
Estimated Equity
$403,159
Purchase Details
Closed on
Jul 27, 2011
Sold by
C & M Land & Aledo Land Llc
Bought by
Hughes Stephen C and Hughes Sandra L
Home Financials for this Owner
Home Financials are based on the most recent Mortgage that was taken out on this home.
Original Mortgage
$160,000
Interest Rate
4.53%
Mortgage Type
Stand Alone First
Purchase Details
Closed on
Feb 23, 2010
Sold by
Tankersley Gregory P
Bought by
Hughes Stephen C and Hughes Sandra L
Create a Home Valuation Report for This Property
The Home Valuation Report is an in-depth analysis detailing your home's value as well as a comparison with similar homes in the area
Home Values in the Area
Average Home Value in this Area
Purchase History
| Date | Buyer | Sale Price | Title Company |
|---|---|---|---|
| Hughes Stephen C | -- | Providence Title | |
| Hughes Stephen C | -- | -- | |
| Aledo Land Llc | -- | Providence Title | |
| Hughes Stephen C | -- | -- |
Source: Public Records
Mortgage History
| Date | Status | Borrower | Loan Amount |
|---|---|---|---|
| Open | Hughes Stephen C | $174,650 | |
| Previous Owner | Aledo Land Llc | $160,000 |
Source: Public Records
Tax History Compared to Growth
Tax History
| Year | Tax Paid | Tax Assessment Tax Assessment Total Assessment is a certain percentage of the fair market value that is determined by local assessors to be the total taxable value of land and additions on the property. | Land | Improvement |
|---|---|---|---|---|
| 2025 | $2,896 | $501,424 | -- | -- |
| 2024 | $2,896 | $455,840 | -- | -- |
| 2023 | $2,896 | $414,400 | $0 | $0 |
| 2022 | $7,014 | $376,730 | $50,000 | $326,730 |
| 2021 | $7,285 | $376,730 | $50,000 | $326,730 |
| 2020 | $6,655 | $329,840 | $30,000 | $299,840 |
| 2019 | $6,454 | $329,840 | $30,000 | $299,840 |
| 2018 | $5,898 | $324,270 | $30,000 | $294,270 |
| 2017 | $5,472 | $324,270 | $30,000 | $294,270 |
| 2016 | $4,974 | $224,100 | $30,000 | $194,100 |
| 2015 | $4,539 | $224,100 | $30,000 | $194,100 |
| 2014 | $4,353 | $225,320 | $30,000 | $195,320 |
Source: Public Records
Map
Nearby Homes
- 510 Lockwood Ln
- 368 Lockwood Ln
- 105 Country Green Ct
- 365 Paloma St
- 376 Bonita St
- 365 Bonita St
- 2310 Trace Ridge Dr
- 1421 Highlake Ln
- 2218 Lake Country Dr
- 2109 Valley Dr
- 2214 Lake Country Dr
- 2577 Lockwood Ln
- 2137 Trace Ridge Dr
- 2202 Lakeforest Dr
- 1910 Maplewood Dr
- 2116 Clear Lake Rd
- 344 Clear Lake Ln
- 104 Carriage Hill Ct
- 1905 Clear Creek Dr
- 2020 Maplewood Dr
- 135 Tankersley Ln
- 124 Tankersley Ln
- 138 Tankersley Ln
- 127 Tankersley Ln
- 1425 Old Airport Rd
- 123 Tankersley Ln
- 118 Tankersley Ln
- 148 Tankersley Ln
- 119 Tankersley Ln
- 112 Tankersley Ln
- 106 Tankersley Ln
- 113 Tankersley Ln
- 1503 Old Airport Rd
- 2821 Carter Ln
- Lot 53 Justin Dr
- 107 Tankersley Ln
- 100 Tankersley Ln
- 2825 Carter Ln
- 1511 Old Airport Rd
- Lot 56 Justin Dr