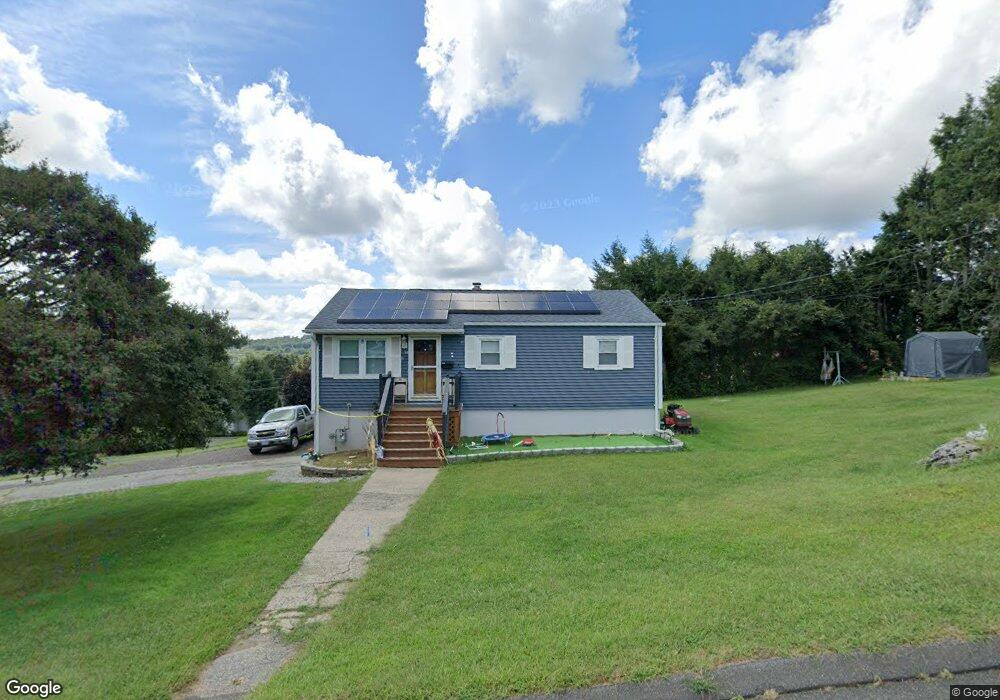
139 Tarbell Ave Oakville, CT 06779
Estimated Value: $281,000 - $333,000
3
Beds
1
Bath
912
Sq Ft
$328/Sq Ft
Est. Value
About This Home
This home is located at 139 Tarbell Ave, Oakville, CT 06779 and is currently estimated at $299,530, approximately $328 per square foot. 139 Tarbell Ave is a home located in Litchfield County with nearby schools including John Trumbull Primary School, Swift Middle School, and Watertown High School.
Ownership History
Date
Name
Owned For
Owner Type
Purchase Details
Closed on
Apr 26, 2019
Sold by
Olavarria Miguel
Bought by
Cortorreal Janet
Current Estimated Value
Purchase Details
Closed on
Jun 5, 2006
Sold by
Macchi Philip and Macchi Marianne
Bought by
Cortorreac Janet
Create a Home Valuation Report for This Property
The Home Valuation Report is an in-depth analysis detailing your home's value as well as a comparison with similar homes in the area
Home Values in the Area
Average Home Value in this Area
Purchase History
| Date | Buyer | Sale Price | Title Company |
|---|---|---|---|
| Cortorreal Janet | -- | -- | |
| Cortorreac Janet | $217,000 | -- |
Source: Public Records
Mortgage History
| Date | Status | Borrower | Loan Amount |
|---|---|---|---|
| Previous Owner | Cortorreac Janet | $122,400 | |
| Previous Owner | Cortorreac Janet | $112,000 | |
| Previous Owner | Cortorreac Janet | $108,000 |
Source: Public Records
Tax History
| Year | Tax Paid | Tax Assessment Tax Assessment Total Assessment is a certain percentage of the fair market value that is determined by local assessors to be the total taxable value of land and additions on the property. | Land | Improvement |
|---|---|---|---|---|
| 2025 | $4,994 | $166,250 | $45,150 | $121,100 |
| 2024 | $4,717 | $166,250 | $45,150 | $121,100 |
| 2023 | $4,121 | $111,800 | $43,900 | $67,900 |
| 2022 | $3,906 | $111,800 | $43,900 | $67,900 |
| 2021 | $3,864 | $111,800 | $43,900 | $67,900 |
| 2020 | $3,711 | $111,800 | $43,900 | $67,900 |
| 2019 | $3,711 | $111,800 | $43,900 | $67,900 |
| 2018 | $3,540 | $105,400 | $48,200 | $57,200 |
| 2017 | $3,360 | $105,400 | $48,200 | $57,200 |
| 2016 | $3,256 | $105,400 | $48,200 | $57,200 |
| 2015 | $3,173 | $105,400 | $48,200 | $57,200 |
| 2014 | $3,069 | $105,400 | $48,200 | $57,200 |
Source: Public Records
Map
Nearby Homes
- 71 Camp St
- 111 Fairview Ave
- 9 Rockland Ave
- 23 Prospect Ave
- 60 Heath St
- 19 Henry St
- 464 French St
- 48 Rockdale Ave
- 93 Sunnyside Ave
- 106 Augusta St
- 54 Buckingham St
- 72 Gorham St
- Falls Ave Falls Ave
- 250 Morro St
- 67 Maple Ave
- 608 Echo Lake Rd
- 178 Bushnell Ave
- 741 Echo Lake Rd
- 62 Woodvine Ave
- 0 Saugus Ave
- 187 Hillcrest Ave
- 124 Tucker Ave
- 144 Tarbell Ave
- 138 Tarbell Ave
- 123 Tarbell Ave
- 159 Tarbell Ave
- 94 Tucker Ave
- 119 Tucker Ave
- 128 Tarbell Ave
- 113 Tucker Ave
- 83 Dalton St
- 103 Dalton St
- 129 Tucker Ave
- 162 Tarbell Ave
- 173 Hillcrest Ave
- 111 Dalton St
- 97 Tucker Ave
- 97 Tucker Ave Unit 2nd f
- 116 Tarbell Ave
Your Personal Tour Guide
Ask me questions while you tour the home.