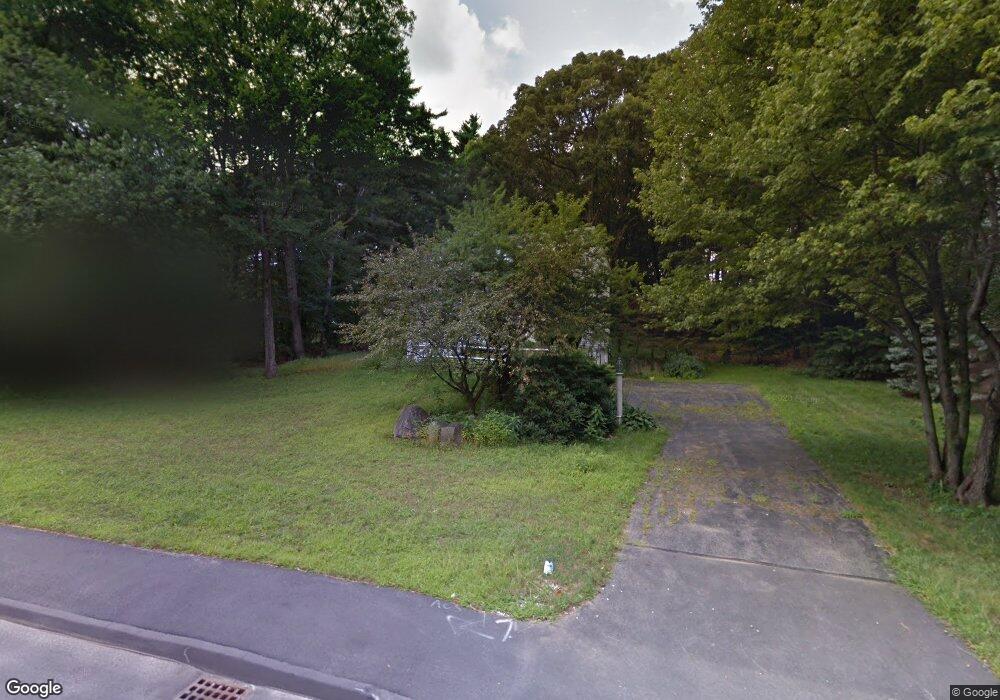
139 Vega Rd Marlborough, MA 01752
Estimated Value: $757,108 - $863,000
3
Beds
3
Baths
2,160
Sq Ft
$371/Sq Ft
Est. Value
About This Home
This home is located at 139 Vega Rd, Marlborough, MA 01752 and is currently estimated at $801,777, approximately $371 per square foot. 139 Vega Rd is a home located in Middlesex County with nearby schools including Marlborough High School, New Covenant Christian School, and Glenhaven Academy - JRI School.
Ownership History
Date
Name
Owned For
Owner Type
Purchase Details
Closed on
Mar 22, 2024
Sold by
Mccarthy Charles and Mccarthy Christina
Bought by
Mccarthy Ft and Mccarthy
Current Estimated Value
Purchase Details
Closed on
Nov 13, 2015
Sold by
Morgan Bruce D and Nationstar Mortgage Ll
Bought by
Mccarthy Charles and Mccarthy Christina
Purchase Details
Closed on
Apr 2, 2007
Sold by
Leone-Mahaney Lisa J
Bought by
Morgan Bruce D
Home Financials for this Owner
Home Financials are based on the most recent Mortgage that was taken out on this home.
Original Mortgage
$366,000
Interest Rate
6.33%
Mortgage Type
Purchase Money Mortgage
Purchase Details
Closed on
Jan 23, 1998
Sold by
Robson Steven C and Robson Patricia A
Bought by
Mahaney R Scott and Mahaney Robert S
Home Financials for this Owner
Home Financials are based on the most recent Mortgage that was taken out on this home.
Original Mortgage
$164,250
Interest Rate
7.11%
Mortgage Type
Purchase Money Mortgage
Purchase Details
Closed on
Oct 1, 1991
Sold by
Lefaivre Philip R and Lefaivre Mary
Bought by
Robson Steven C and Robson Patricia
Home Financials for this Owner
Home Financials are based on the most recent Mortgage that was taken out on this home.
Original Mortgage
$168,000
Interest Rate
9.1%
Mortgage Type
Purchase Money Mortgage
Create a Home Valuation Report for This Property
The Home Valuation Report is an in-depth analysis detailing your home's value as well as a comparison with similar homes in the area
Home Values in the Area
Average Home Value in this Area
Purchase History
| Date | Buyer | Sale Price | Title Company |
|---|---|---|---|
| Mccarthy Ft | -- | None Available | |
| Mccarthy Charles | $290,000 | -- | |
| Morgan Bruce D | $457,500 | -- | |
| Mahaney R Scott | $219,000 | -- | |
| Mahaney R Scott R | $219,000 | -- | |
| Robson Steven C | $210,000 | -- | |
| Robson Steven C | $210,000 | -- |
Source: Public Records
Mortgage History
| Date | Status | Borrower | Loan Amount |
|---|---|---|---|
| Previous Owner | Morgan Bruce D | $366,000 | |
| Previous Owner | Robson Steven C | $164,250 | |
| Previous Owner | Robson Steven C | $168,000 |
Source: Public Records
Tax History Compared to Growth
Tax History
| Year | Tax Paid | Tax Assessment Tax Assessment Total Assessment is a certain percentage of the fair market value that is determined by local assessors to be the total taxable value of land and additions on the property. | Land | Improvement |
|---|---|---|---|---|
| 2025 | $6,504 | $659,600 | $252,700 | $406,900 |
| 2024 | $6,314 | $616,600 | $229,800 | $386,800 |
| 2023 | $6,633 | $574,800 | $189,800 | $385,000 |
| 2022 | $6,466 | $492,800 | $181,100 | $311,700 |
| 2021 | $34,948 | $462,000 | $151,500 | $310,500 |
| 2020 | $0 | $441,800 | $144,500 | $297,300 |
| 2019 | $6,054 | $430,300 | $141,900 | $288,400 |
| 2018 | $6,055 | $413,900 | $131,000 | $282,900 |
| 2017 | $5,907 | $385,600 | $133,200 | $252,400 |
| 2016 | $5,706 | $372,000 | $133,200 | $238,800 |
| 2015 | $5,867 | $372,300 | $143,800 | $228,500 |
Source: Public Records
Map
Nearby Homes