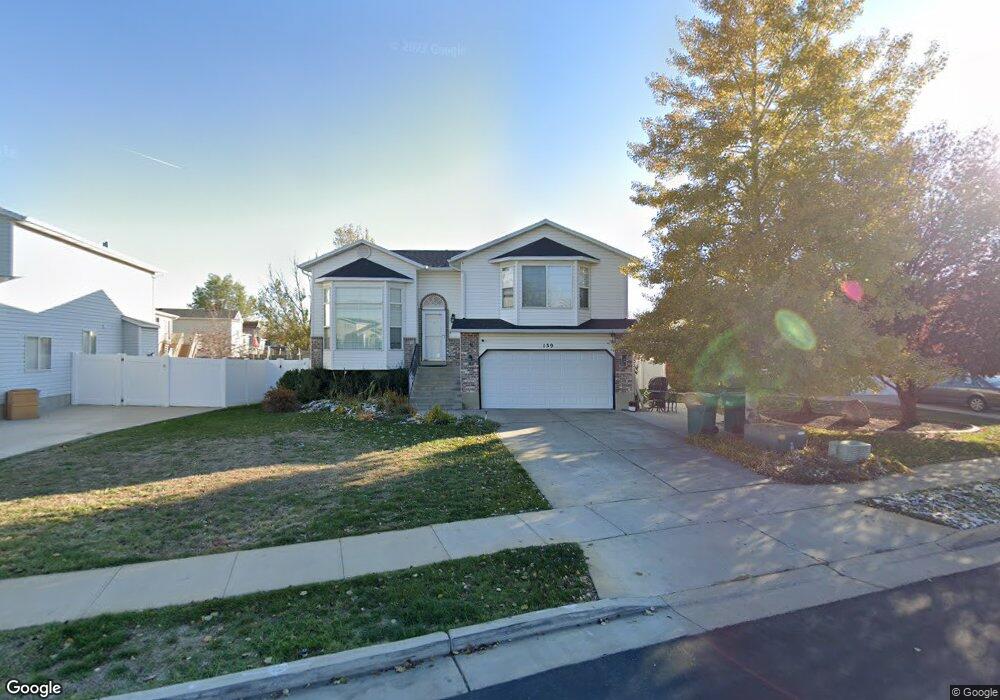
139 W 1425 N Layton, UT 84041
Estimated Value: $465,000 - $524,000
4
Beds
3
Baths
2,384
Sq Ft
$206/Sq Ft
Est. Value
About This Home
This home is located at 139 W 1425 N, Layton, UT 84041 and is currently estimated at $491,931, approximately $206 per square foot. 139 W 1425 N is a home located in Davis County with nearby schools including Crestview Elementary School, Central Davis Junior High School, and Northridge High School.
Ownership History
Date
Name
Owned For
Owner Type
Purchase Details
Closed on
Mar 24, 2009
Sold by
Barlow Greg and Barlow Carolyn
Bought by
Barlow Gregory and Barlow Carolyn
Current Estimated Value
Home Financials for this Owner
Home Financials are based on the most recent Mortgage that was taken out on this home.
Original Mortgage
$219,667
Outstanding Balance
$139,826
Interest Rate
5.15%
Mortgage Type
FHA
Estimated Equity
$352,105
Purchase Details
Closed on
Mar 5, 1998
Sold by
Woodside Homes Corp
Bought by
Barlow Greg and Barlow Carolyn
Home Financials for this Owner
Home Financials are based on the most recent Mortgage that was taken out on this home.
Original Mortgage
$121,400
Interest Rate
7.11%
Create a Home Valuation Report for This Property
The Home Valuation Report is an in-depth analysis detailing your home's value as well as a comparison with similar homes in the area
Home Values in the Area
Average Home Value in this Area
Purchase History
| Date | Buyer | Sale Price | Title Company |
|---|---|---|---|
| Barlow Gregory | -- | Founders Title Co Layton | |
| Barlow Greg | -- | First American Title Co |
Source: Public Records
Mortgage History
| Date | Status | Borrower | Loan Amount |
|---|---|---|---|
| Open | Barlow Gregory | $219,667 | |
| Closed | Barlow Greg | $121,400 |
Source: Public Records
Tax History Compared to Growth
Tax History
| Year | Tax Paid | Tax Assessment Tax Assessment Total Assessment is a certain percentage of the fair market value that is determined by local assessors to be the total taxable value of land and additions on the property. | Land | Improvement |
|---|---|---|---|---|
| 2025 | $2,253 | $236,500 | $112,593 | $123,907 |
| 2024 | $2,159 | $228,250 | $130,528 | $97,722 |
| 2023 | $2,146 | $400,000 | $149,143 | $250,857 |
| 2022 | $2,217 | $224,400 | $80,639 | $143,761 |
| 2021 | $2,074 | $313,000 | $117,991 | $195,009 |
| 2020 | $1,871 | $271,000 | $97,207 | $173,793 |
| 2019 | $1,833 | $260,000 | $90,475 | $169,525 |
| 2018 | $1,650 | $235,000 | $90,475 | $144,525 |
| 2016 | $1,547 | $113,630 | $30,237 | $83,393 |
| 2015 | $1,464 | $102,080 | $30,237 | $71,843 |
| 2014 | $1,500 | $106,971 | $30,237 | $76,734 |
| 2013 | -- | $101,061 | $26,884 | $74,177 |
Source: Public Records
Map
Nearby Homes
- 103 W 1275 N
- 1490 N 175 W
- 1583 N 25 E
- 1180 N 100 E
- 1096 N 300 W
- 1553 N 250 E
- 324 E 1325 N
- 1474 N 285 E
- 398 Paul Ave
- 1908 N 200 W
- 1837 N 440 W
- 2044 Evans Cove Loop
- 2048 Evans Cove Loop
- 2053 Evans Cove Loop Unit 39
- 937 Rainbow Dr
- 9 W 2150 N
- 1366 N Main St Unit 5
- 23 E 2150 N
- 785 Sherwood Dr
- 495 Spurlock St