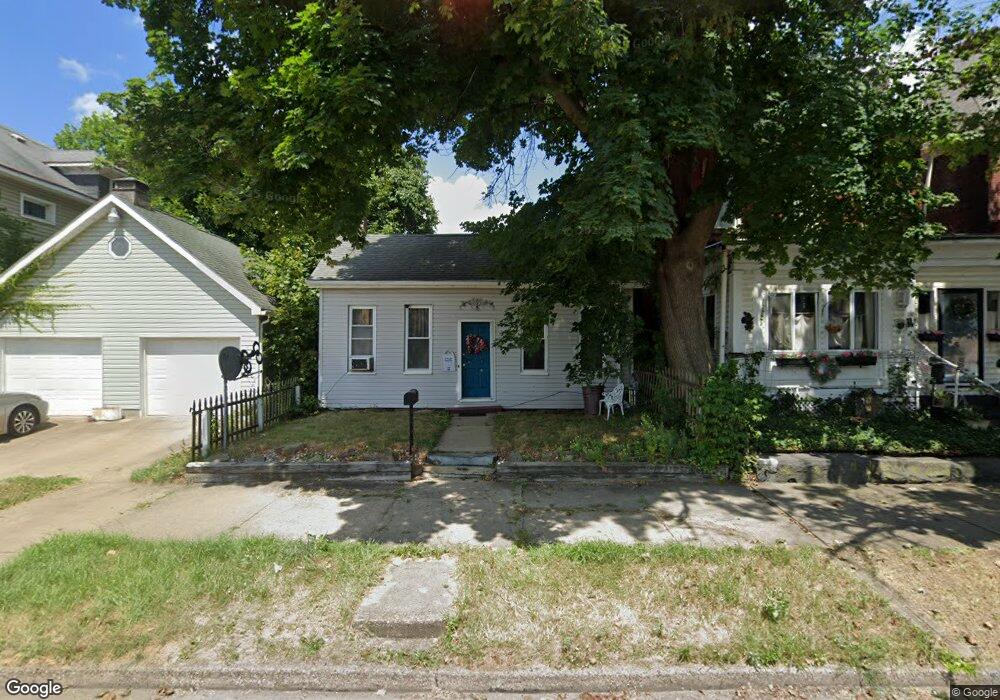
139 W 4th St East Liverpool, OH 43920
Estimated Value: $40,000 - $64,000
2
Beds
1
Bath
1,008
Sq Ft
$57/Sq Ft
Est. Value
About This Home
This home is located at 139 W 4th St, East Liverpool, OH 43920 and is currently estimated at $57,519, approximately $57 per square foot. 139 W 4th St is a home located in Columbiana County with nearby schools including Westgate Middle School, LaCroft Elementary School, and East Liverpool High School.
Ownership History
Date
Name
Owned For
Owner Type
Purchase Details
Closed on
Jun 8, 2001
Sold by
Morris John and Morris Angela
Bought by
Fink Colen and Sullivan Heather
Current Estimated Value
Home Financials for this Owner
Home Financials are based on the most recent Mortgage that was taken out on this home.
Original Mortgage
$34,500
Outstanding Balance
$13,161
Interest Rate
7.16%
Mortgage Type
Seller Take Back
Estimated Equity
$44,358
Purchase Details
Closed on
Jul 17, 1996
Sold by
Est Wanda M Smith
Bought by
John D Morris
Purchase Details
Closed on
May 10, 1989
Sold by
Morris John Douglas
Bought by
Smith Wanda M
Create a Home Valuation Report for This Property
The Home Valuation Report is an in-depth analysis detailing your home's value as well as a comparison with similar homes in the area
Home Values in the Area
Average Home Value in this Area
Purchase History
| Date | Buyer | Sale Price | Title Company |
|---|---|---|---|
| Fink Colen | $37,000 | -- | |
| John D Morris | $7,000 | -- | |
| Smith Wanda M | $4,000 | -- |
Source: Public Records
Mortgage History
| Date | Status | Borrower | Loan Amount |
|---|---|---|---|
| Open | Fink Colen | $34,500 |
Source: Public Records
Tax History Compared to Growth
Tax History
| Year | Tax Paid | Tax Assessment Tax Assessment Total Assessment is a certain percentage of the fair market value that is determined by local assessors to be the total taxable value of land and additions on the property. | Land | Improvement |
|---|---|---|---|---|
| 2024 | $461 | $10,930 | $600 | $10,330 |
| 2023 | $461 | $10,930 | $600 | $10,330 |
| 2022 | $461 | $10,930 | $600 | $10,330 |
| 2021 | $408 | $8,860 | $530 | $8,330 |
| 2020 | $408 | $8,860 | $530 | $8,330 |
| 2019 | $408 | $8,860 | $530 | $8,330 |
| 2018 | $395 | $8,050 | $490 | $7,560 |
| 2017 | $416 | $8,050 | $490 | $7,560 |
| 2016 | $436 | $8,130 | $390 | $7,740 |
| 2015 | $409 | $8,130 | $390 | $7,740 |
| 2014 | $467 | $8,130 | $390 | $7,740 |
Source: Public Records
Map
Nearby Homes