Estimated Value: $421,000 - $442,000
4
Beds
3
Baths
1,858
Sq Ft
$235/Sq Ft
Est. Value
About This Home
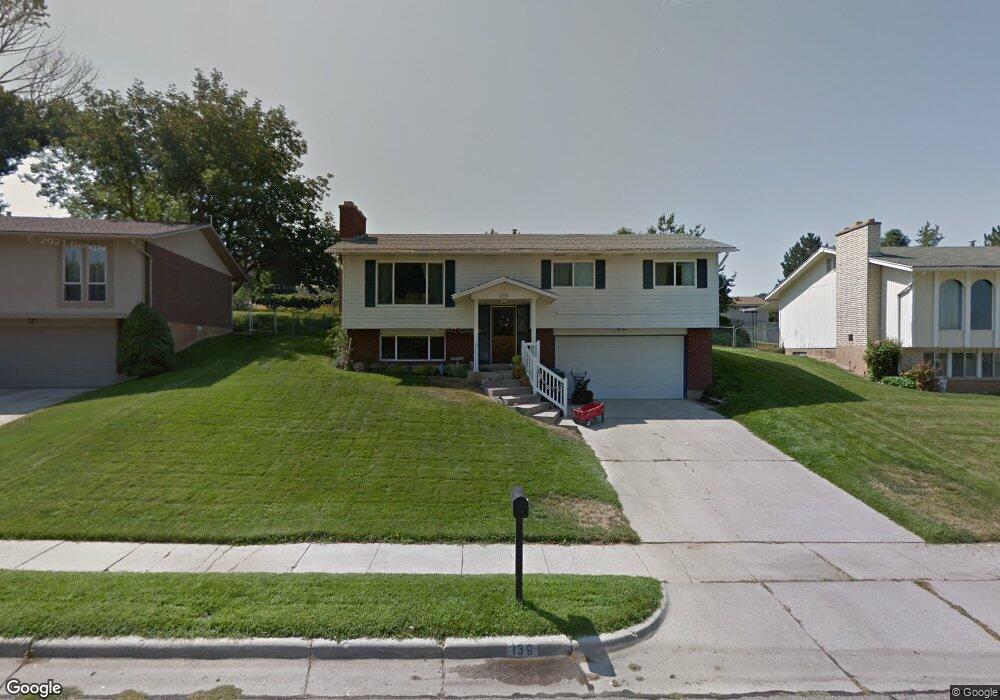
This home is located at 139 W 5300 S, Ogden, UT 84405 and is currently estimated at $435,780, approximately $234 per square foot. 139 W 5300 S is a home located in Weber County with nearby schools including Roosevelt School, T.H. Bell Junior High School, and Bonneville High School.
Ownership History
Date
Name
Owned For
Owner Type
Purchase Details
Closed on
Jun 29, 2022
Sold by
Ryan Jamieson
Bought by
Flores Edgar Zamora and Velazquez Ervin Eduardo
Current Estimated Value
Purchase Details
Closed on
Nov 23, 2016
Bought by
Jamieson Ryan
Home Financials for this Owner
Home Financials are based on the most recent Mortgage that was taken out on this home.
Original Mortgage
$200,000
Interest Rate
4.03%
Purchase Details
Closed on
Aug 2, 2006
Sold by
Yearsley Adam B and Yearsley Valerie L
Bought by
Cohen Scott M and Cohen Lauren A M
Home Financials for this Owner
Home Financials are based on the most recent Mortgage that was taken out on this home.
Original Mortgage
$9,200
Interest Rate
6.69%
Mortgage Type
Stand Alone Second
Purchase Details
Closed on
Jul 1, 2003
Sold by
Dreiling Larry Joseph and Dreiling Tamra
Bought by
Yearsley Adam B and Yearsley Valerie L
Create a Home Valuation Report for This Property
The Home Valuation Report is an in-depth analysis detailing your home's value as well as a comparison with similar homes in the area
Home Values in the Area
Average Home Value in this Area
Purchase History
| Date | Buyer | Sale Price | Title Company |
|---|---|---|---|
| Flores Edgar Zamora | -- | Old Republic Title | |
| Jamieson Ryan | -- | -- | |
| Cohen Scott M | -- | First American Title | |
| Yearsley Adam B | -- | Equity Title |
Source: Public Records
Mortgage History
| Date | Status | Borrower | Loan Amount |
|---|---|---|---|
| Previous Owner | Jamieson Ryan | $200,000 | |
| Previous Owner | Jamieson Ryan | -- | |
| Previous Owner | Cohen Scott M | $9,200 | |
| Previous Owner | Cohen Scott M | $157,528 |
Source: Public Records
Tax History Compared to Growth
Tax History
| Year | Tax Paid | Tax Assessment Tax Assessment Total Assessment is a certain percentage of the fair market value that is determined by local assessors to be the total taxable value of land and additions on the property. | Land | Improvement |
|---|---|---|---|---|
| 2025 | $2,543 | $419,843 | $128,763 | $291,080 |
| 2024 | $2,543 | $225,499 | $70,819 | $154,680 |
| 2023 | $2,462 | $218,350 | $71,008 | $147,342 |
| 2022 | $2,605 | $238,150 | $68,289 | $169,861 |
| 2021 | $2,024 | $303,000 | $64,332 | $238,668 |
| 2020 | $1,871 | $256,000 | $54,454 | $201,546 |
| 2019 | $1,834 | $235,000 | $49,330 | $185,670 |
| 2018 | $1,674 | $212,000 | $49,330 | $162,670 |
| 2017 | $1,444 | $173,000 | $40,503 | $132,497 |
| 2016 | $1,236 | $81,599 | $20,536 | $61,063 |
| 2015 | $1,209 | $78,614 | $20,536 | $58,078 |
| 2014 | $1,128 | $72,579 | $20,536 | $52,043 |
Source: Public Records
Map
Nearby Homes
- 5226 S 200 W
- 5454 S 150 E Unit 39
- 283 E 5450 S Unit 20
- 5488 S 250 E
- 5465 S 250 W
- 5420 S 350 E Unit 43
- 5530 S 100 W
- 376 W 5300 S
- 5033 S 150 E
- 1500 N Spring Creek Ln E
- 246 W 5000 S
- 405 W 5100 S
- 125 W 4900 S Unit 9
- 445 W 5100 S
- 390 W 5050 S
- 5155 S Ridgeline Dr
- 715 S 350 E
- 5282 S 575 W
- 4931 S 300 W
- 295 W 5650 S