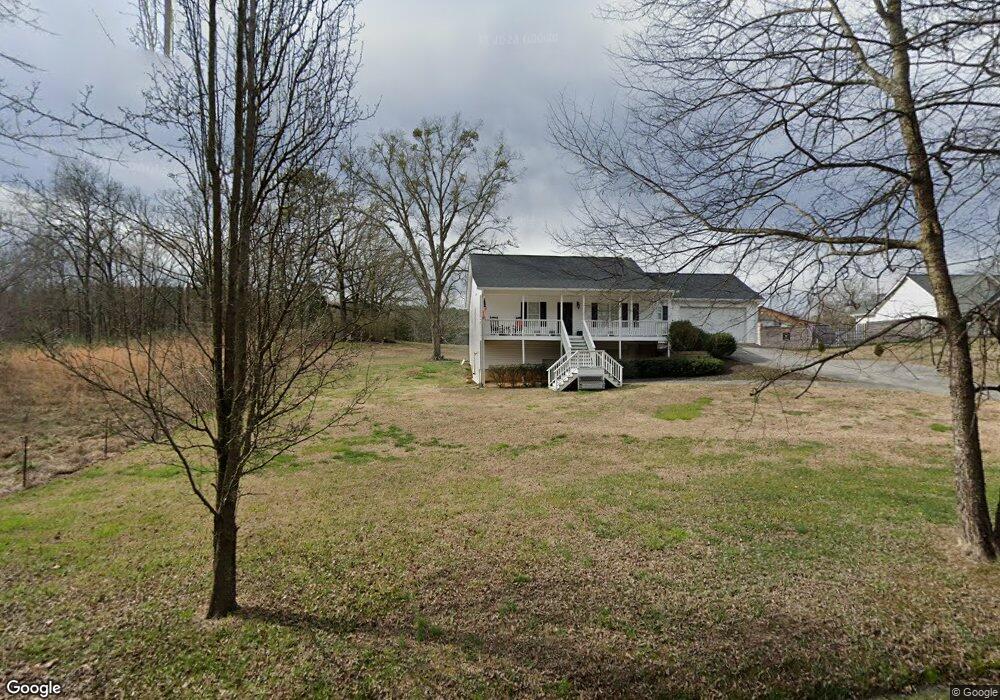
139 W Pine Chapel Rd NE Calhoun, GA 30701
Estimated Value: $215,000 - $286,000
3
Beds
2
Baths
1,326
Sq Ft
$187/Sq Ft
Est. Value
About This Home
This home is located at 139 W Pine Chapel Rd NE, Calhoun, GA 30701 and is currently estimated at $248,115, approximately $187 per square foot. 139 W Pine Chapel Rd NE is a home located in Gordon County with nearby schools including Red Bud Elementary School, Red Bud Middle School, and Sonoraville High School.
Ownership History
Date
Name
Owned For
Owner Type
Purchase Details
Closed on
May 13, 2022
Sold by
Hardin Mark Russell
Bought by
Hardin Mark Russell and Hardin Deborah Louise
Current Estimated Value
Purchase Details
Closed on
Dec 7, 2011
Sold by
Community & Southern Bank
Bought by
Hardin Mark Russell
Home Financials for this Owner
Home Financials are based on the most recent Mortgage that was taken out on this home.
Original Mortgage
$80,206
Interest Rate
4.06%
Mortgage Type
New Conventional
Purchase Details
Closed on
Sep 17, 2010
Sold by
Edifice Homes Llc
Bought by
Community & Southern Bank
Purchase Details
Closed on
Mar 14, 2007
Sold by
Springboard Investments Ll
Bought by
Edifice Homes Llc
Purchase Details
Closed on
Dec 8, 2006
Sold by
I Buy Inc
Bought by
Springboard Investments Llc
Create a Home Valuation Report for This Property
The Home Valuation Report is an in-depth analysis detailing your home's value as well as a comparison with similar homes in the area
Home Values in the Area
Average Home Value in this Area
Purchase History
| Date | Buyer | Sale Price | Title Company |
|---|---|---|---|
| Hardin Mark Russell | -- | -- | |
| Hardin Mark Russell | $75,750 | -- | |
| Community & Southern Bank | -- | -- | |
| Edifice Homes Llc | -- | -- | |
| Springboard Investments Llc | $125,000 | -- | |
| I Buy Inc | $117,000 | -- |
Source: Public Records
Mortgage History
| Date | Status | Borrower | Loan Amount |
|---|---|---|---|
| Previous Owner | Hardin Mark Russell | $80,206 |
Source: Public Records
Tax History Compared to Growth
Tax History
| Year | Tax Paid | Tax Assessment Tax Assessment Total Assessment is a certain percentage of the fair market value that is determined by local assessors to be the total taxable value of land and additions on the property. | Land | Improvement |
|---|---|---|---|---|
| 2024 | $1,719 | $69,680 | $1,520 | $68,160 |
| 2023 | $1,612 | $65,440 | $1,520 | $63,920 |
| 2022 | $1,603 | $61,320 | $1,520 | $59,800 |
| 2021 | $1,365 | $50,720 | $1,520 | $49,200 |
| 2020 | $1,412 | $51,280 | $1,520 | $49,760 |
| 2019 | $1,419 | $51,280 | $1,520 | $49,760 |
| 2018 | $1,321 | $47,880 | $1,520 | $46,360 |
| 2017 | $1,292 | $45,600 | $1,520 | $44,080 |
| 2016 | $1,295 | $45,600 | $1,520 | $44,080 |
| 2015 | $1,284 | $44,840 | $1,520 | $43,320 |
| 2014 | $1,206 | $43,405 | $1,539 | $41,866 |
Source: Public Records
Map
Nearby Homes
- 155 Greeson Loop NE
- 548 Corinth Rd NE
- 246 Defoor Rd NE
- 2630 Chatsworth Highway 225 NE
- 2467 Owens Gin Rd NE
- 0 Nickelsville Rd NW Unit 20148653
- 937 Aurora Ln
- 1535 Hunts Gin Rd
- LOT 4 Hunts Gin Rd
- 00 Hunts Gin Rd L2
- 486 County Line Rd NE
- 923 County Line Rd
- 3961 Nicklesville Rd NE
- 3959 Nicklesville Rd NE
- 0 Owens Gin Rd NE Unit 10605970
- 0 Owens Gin Rd NE Unit 7650167
- 0 Owens Gin Rd NE Unit 10581957
- 0 Owens Gin Rd NE
- 307 Craigtown Rd NE
- 426 Fields Ferry Dr NE
- 131 W Pine Chapel Rd NE
- 3163 Chatsworth Hwy 225 NE
- 193 W Pine Chapel Rd NE
- 272 W Pine Chapel Rd NE
- 272 W Pine Chapel Rd NE
- 3386 Chatsworth Highway 225 NE
- 3360 Chatsworth Hwy 225 NE
- 3530 Chatsworth Highway 225 NE
- 3394 Chatsworth Hwy 225 NE
- 3386 Chatsworth Hwy 225 NE
- 138 Corinth Rd NE
- 3118 Chatsworth Hwy 225 NE
- 129 Corinth Rd NE
- 318 W Pine Chapel Rd NE
- 3071 Chatsworth Highway 225 NE
- 151 Corinth Rd NE
- 3285 Chatsworth Highway 225 NE
- 3255 Chatsworth Highway 225 NE
- 164 Corinth Rd NE
- 3286 Chatsworth Highway 225 NE