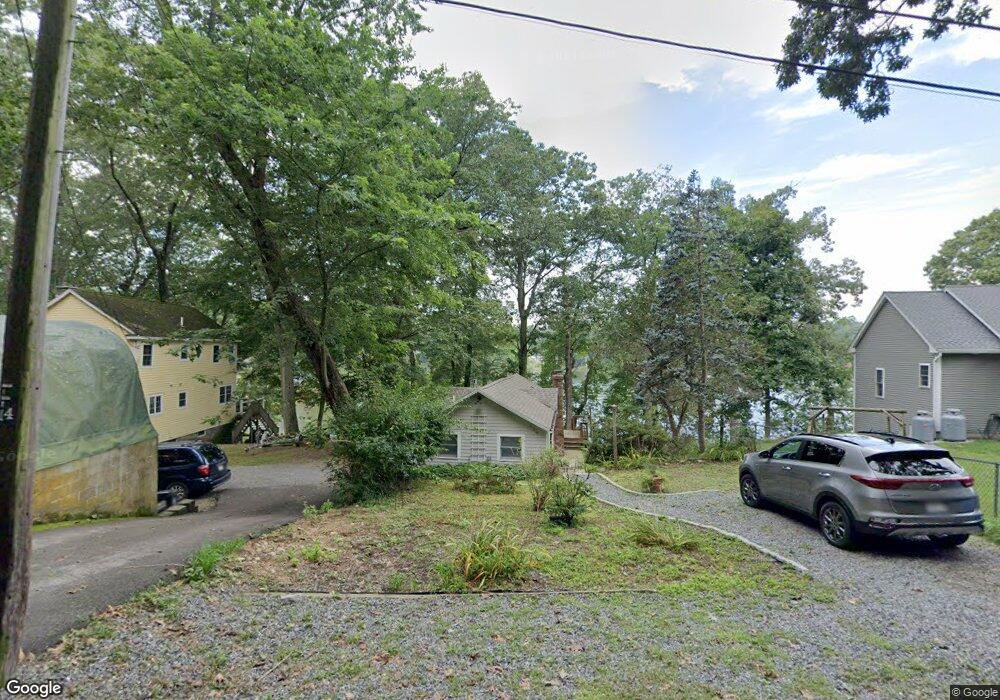
139 Walnut Rd Wrentham, MA 02093
Estimated Value: $399,000 - $572,000
1
Bed
1
Bath
1,142
Sq Ft
$423/Sq Ft
Est. Value
About This Home
This home is located at 139 Walnut Rd, Wrentham, MA 02093 and is currently estimated at $483,128, approximately $423 per square foot. 139 Walnut Rd is a home located in Norfolk County with nearby schools including Delaney Elementary School, Charles E Roderick, and The Sage School.
Ownership History
Date
Name
Owned For
Owner Type
Purchase Details
Closed on
Sep 19, 2023
Sold by
Jordan Paul and Jordan Marla C
Bought by
Paul Jordan Irt and Goulet
Current Estimated Value
Purchase Details
Closed on
May 17, 2007
Sold by
Macarthur Sarah
Bought by
Jordan Paul and Jordan Marla C
Home Financials for this Owner
Home Financials are based on the most recent Mortgage that was taken out on this home.
Original Mortgage
$287,900
Interest Rate
6.18%
Mortgage Type
Purchase Money Mortgage
Purchase Details
Closed on
Dec 10, 1999
Sold by
Rockwood Jeffrey
Bought by
Macarthur Sarah
Home Financials for this Owner
Home Financials are based on the most recent Mortgage that was taken out on this home.
Original Mortgage
$124,110
Interest Rate
7.9%
Mortgage Type
Purchase Money Mortgage
Create a Home Valuation Report for This Property
The Home Valuation Report is an in-depth analysis detailing your home's value as well as a comparison with similar homes in the area
Purchase History
We collect this data history from publicly available records. To have your information removed, we recommend requesting removal directly through your county’s website.
| Date | Buyer | Sale Price | Title Company |
|---|---|---|---|
| Paul Jordan Irt | -- | None Available | |
| Jordan Paul | $319,900 | -- | |
| Jordan Paul | $319,900 | -- | |
| Macarthur Sarah | $137,900 | -- |
Source: Public Records
Mortgage History
We collect this data history from publicly available records. To have your information removed, we recommend requesting removal directly through your county’s website.
| Date | Status | Borrower | Loan Amount |
|---|---|---|---|
| Previous Owner | Jordan Paul | $287,900 | |
| Previous Owner | Macarthur Sarah | $124,110 |
Source: Public Records
Tax History
| Year | Tax Paid | Tax Assessment Tax Assessment Total Assessment is a certain percentage of the fair market value that is determined by local assessors to be the total taxable value of land and additions on the property. | Land | Improvement |
|---|---|---|---|---|
| 2025 | $4,779 | $412,300 | $266,900 | $145,400 |
| 2024 | $4,606 | $383,800 | $277,600 | $106,200 |
| 2023 | $4,257 | $337,300 | $252,400 | $84,900 |
| 2022 | $4,208 | $307,800 | $229,500 | $78,300 |
| 2021 | $4,279 | $304,100 | $229,500 | $74,600 |
| 2020 | $3,788 | $265,800 | $188,600 | $77,200 |
| 2019 | $3,546 | $251,100 | $175,200 | $75,900 |
| 2018 | $3,754 | $263,600 | $175,500 | $88,100 |
| 2017 | $3,591 | $252,000 | $172,100 | $79,900 |
| 2016 | $3,506 | $245,500 | $167,100 | $78,400 |
| 2015 | $3,399 | $226,900 | $160,700 | $66,200 |
| 2014 | $3,717 | $242,800 | $178,300 | $64,500 |
Source: Public Records
Map
Nearby Homes
Your Personal Tour Guide
Ask me questions while you tour the home.