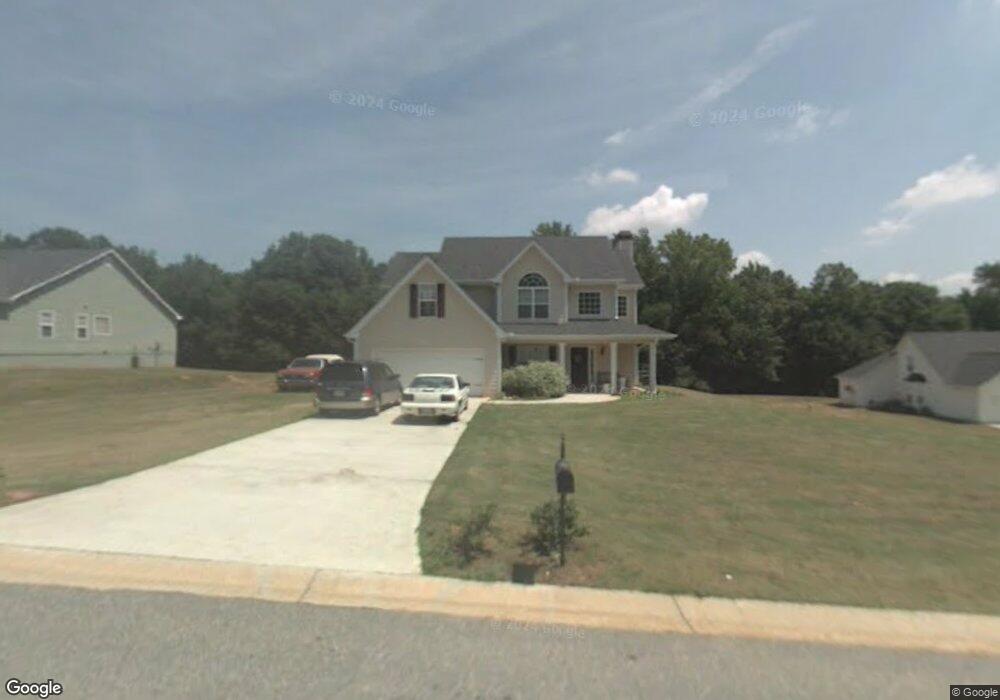
139 Waterwheel Dr Unit 6 Commerce, GA 30529
Estimated Value: $376,686 - $438,000
3
Beds
3
Baths
1,990
Sq Ft
$206/Sq Ft
Est. Value
About This Home
This home is located at 139 Waterwheel Dr Unit 6, Commerce, GA 30529 and is currently estimated at $409,922, approximately $205 per square foot. 139 Waterwheel Dr Unit 6 is a home located in Jackson County with nearby schools including Satilla Elementary School, East Jackson Elementary School, and East Jackson Middle School.
Ownership History
Date
Name
Owned For
Owner Type
Purchase Details
Closed on
Mar 4, 2015
Sold by
Farmer Joshua B
Bought by
Farmer Joshua B and Farmer Logan B
Current Estimated Value
Home Financials for this Owner
Home Financials are based on the most recent Mortgage that was taken out on this home.
Original Mortgage
$152,855
Outstanding Balance
$117,115
Interest Rate
3.69%
Mortgage Type
New Conventional
Estimated Equity
$292,807
Purchase Details
Closed on
Sep 7, 2005
Sold by
Rackley Constructions Inc
Bought by
Rackley Steven S
Home Financials for this Owner
Home Financials are based on the most recent Mortgage that was taken out on this home.
Original Mortgage
$131,000
Interest Rate
5.86%
Mortgage Type
New Conventional
Purchase Details
Closed on
Jan 23, 2003
Sold by
Cooper Dwight R and Mcdaniel Kenneth
Bought by
Rackley Construction Inc
Create a Home Valuation Report for This Property
The Home Valuation Report is an in-depth analysis detailing your home's value as well as a comparison with similar homes in the area
Home Values in the Area
Average Home Value in this Area
Purchase History
| Date | Buyer | Sale Price | Title Company |
|---|---|---|---|
| Farmer Joshua B | -- | -- | |
| Farmer Joshua B | $160,900 | -- | |
| Rackley Steven S | -- | -- | |
| Rackley Construction Inc | $57,000 | -- |
Source: Public Records
Mortgage History
| Date | Status | Borrower | Loan Amount |
|---|---|---|---|
| Open | Farmer Joshua B | $152,855 | |
| Closed | Farmer Joshua B | $152,855 | |
| Previous Owner | Rackley Steven S | $131,000 |
Source: Public Records
Tax History Compared to Growth
Tax History
| Year | Tax Paid | Tax Assessment Tax Assessment Total Assessment is a certain percentage of the fair market value that is determined by local assessors to be the total taxable value of land and additions on the property. | Land | Improvement |
|---|---|---|---|---|
| 2024 | $3,203 | $128,680 | $28,000 | $100,680 |
| 2023 | $3,238 | $117,520 | $28,000 | $89,520 |
| 2022 | $2,829 | $98,640 | $28,000 | $70,640 |
| 2021 | $2,433 | $84,240 | $13,600 | $70,640 |
| 2020 | $2,378 | $75,160 | $13,600 | $61,560 |
| 2019 | $2,414 | $75,160 | $13,600 | $61,560 |
| 2018 | $2,348 | $72,080 | $13,600 | $58,480 |
| 2017 | $2,109 | $64,211 | $13,600 | $50,611 |
| 2016 | $2,121 | $64,211 | $13,600 | $50,611 |
| 2015 | $1,716 | $51,721 | $4,800 | $46,921 |
| 2014 | $1,522 | $45,523 | $4,800 | $40,723 |
| 2013 | -- | $45,522 | $4,800 | $40,722 |
Source: Public Records
Map
Nearby Homes
- 268 Old Hoods Mill Rd
- 1136 Hoods Mill Rd
- 1006 Old Hoods Mill Rd
- 108 Albright Ct
- 236 Dewaters Rd
- 687 Hoods Academy Rd
- 201 Stillmeadow Dr
- 708 Sheep Pasture Rd
- 410 Wilson Cemetery Rd
- 2883 Highway 441 S
- 162 Edgefield Dr
- 829 River Fall Dr
- 42 Edgefield Dr
- 3319 U S 441
- 19 Hampton Creek Rd
- 0 Sheep Pasture Rd Unit 10643588
- 537 Forest Path
- 303 River Mansion Dr
- 883 Harris Lord Cemetery Rd
- 139 Waterwheel Dr
- 115 Waterwheel Dr
- 0 Water Wheel Unit 8092779
- 0 Water Wheel Unit 977717
- 138 Waterwheel Dr
- 157 Waterwheel Dr
- 158 Waterwheel Dr
- 158 Waterwheel Dr Unit 10
- 91 Waterwheel Dr
- 114 Waterwheel Dr Unit 12
- 114 Waterwheel Dr
- 166 Waterwheel Dr
- 165 Waterwheel Dr
- 00 Waterwheel Dr
- lot 3 Waterwheel Dr
- 27 Windmill Ln
- 69 Waterwheel Dr
- 0 Waterwheel Unit 8314332
- 0 Waterwheel Unit 3 7623773
- 0 Waterwheel Unit 7014921