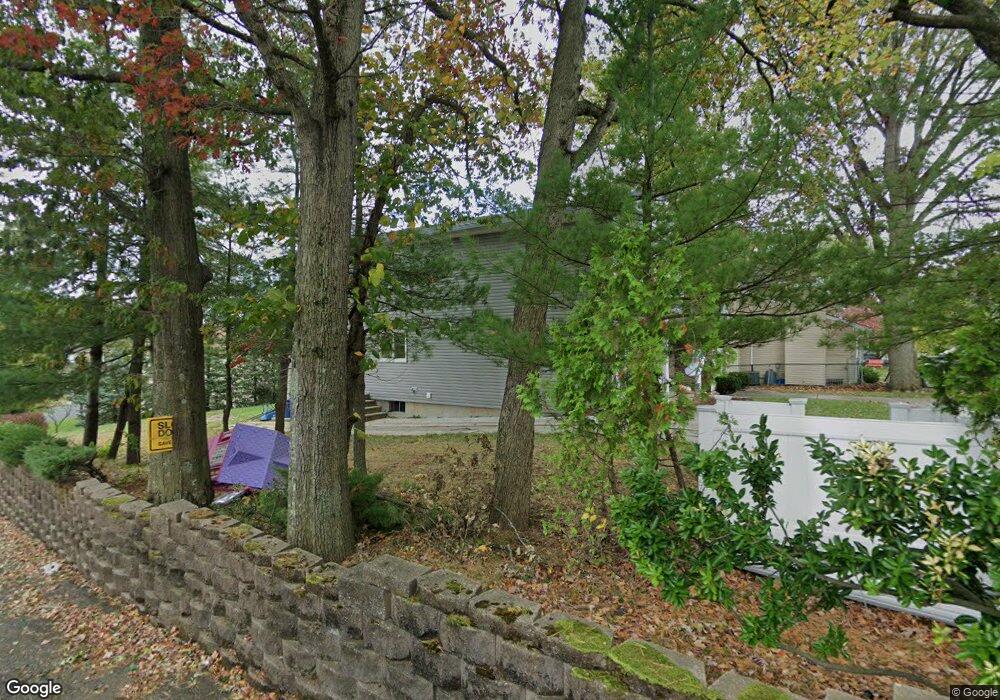
139 Weiner St Staten Island, NY 10309
Charleston NeighborhoodEstimated Value: $786,101 - $1,301,000
5
Beds
3
Baths
1,944
Sq Ft
$553/Sq Ft
Est. Value
About This Home
This home is located at 139 Weiner St, Staten Island, NY 10309 and is currently estimated at $1,075,275, approximately $553 per square foot. 139 Weiner St is a home located in Richmond County with nearby schools including P.S. 6 Cpl Allan F Kivlehan School, Is 34 Tottenville, and Tottenville High School.
Ownership History
Date
Name
Owned For
Owner Type
Purchase Details
Closed on
Apr 6, 2018
Sold by
Corio Richard J and Corio Jfan
Bought by
Corio Gina M and Mileto Mark V
Current Estimated Value
Home Financials for this Owner
Home Financials are based on the most recent Mortgage that was taken out on this home.
Original Mortgage
$585,062
Outstanding Balance
$514,883
Interest Rate
5.5%
Mortgage Type
FHA
Estimated Equity
$560,392
Purchase Details
Closed on
Nov 21, 2014
Sold by
Krause George J and Wilson Roger
Bought by
Corio Richard J and Corio Jean
Home Financials for this Owner
Home Financials are based on the most recent Mortgage that was taken out on this home.
Original Mortgage
$386,250
Interest Rate
3.93%
Mortgage Type
New Conventional
Purchase Details
Closed on
Nov 10, 2006
Sold by
Wilson Stanley and Wilson Margaret
Bought by
Krause George J and Wilson Roger
Create a Home Valuation Report for This Property
The Home Valuation Report is an in-depth analysis detailing your home's value as well as a comparison with similar homes in the area
Home Values in the Area
Average Home Value in this Area
Purchase History
| Date | Buyer | Sale Price | Title Company |
|---|---|---|---|
| Corio Gina M | -- | The Judicial Title Insurance | |
| Corio Richard J | $515,000 | None Available | |
| Krause George J | -- | Chicago Title Insurance Co |
Source: Public Records
Mortgage History
| Date | Status | Borrower | Loan Amount |
|---|---|---|---|
| Open | Corio Gina M | $585,062 | |
| Closed | Corio Richard J | $386,250 |
Source: Public Records
Tax History Compared to Growth
Tax History
| Year | Tax Paid | Tax Assessment Tax Assessment Total Assessment is a certain percentage of the fair market value that is determined by local assessors to be the total taxable value of land and additions on the property. | Land | Improvement |
|---|---|---|---|---|
| 2025 | $9,340 | $56,880 | $18,146 | $38,734 |
| 2024 | $7,594 | $46,500 | $22,329 | $24,171 |
| 2023 | $7,755 | $46,780 | $18,831 | $27,949 |
| 2022 | $7,513 | $52,500 | $20,940 | $31,560 |
| 2021 | $9,407 | $44,700 | $20,940 | $23,760 |
| 2020 | $9,271 | $48,180 | $20,940 | $27,240 |
| 2019 | $8,644 | $50,160 | $20,940 | $29,220 |
| 2018 | $7,947 | $38,983 | $17,738 | $21,245 |
| 2017 | $7,879 | $38,650 | $11,818 | $26,832 |
| 2016 | $7,461 | $37,324 | $11,293 | $26,031 |
| 2015 | $5,757 | $36,499 | $10,081 | $26,418 |
| 2014 | $5,757 | $34,434 | $10,842 | $23,592 |
Source: Public Records
Map
Nearby Homes
- 282 Boscombe Ave
- 6716 Amboy Rd
- 36 Savona Ct
- 35 Savona Ct
- 95 Station Ave
- 4795 Arthur Kill Rd
- 28 Hallister St
- 66 Pleasant Plains Ave
- 386 Page Ave
- 105 Churchill Ave
- 52 Pleasant Plains Ave
- 26 Station Ave
- 116 Churchill Ave
- 6401 Amboy Rd
- 75 Churchill Ave
- 6384 Amboy Rd
- 6321 Amboy Rd
- 72 Giegerich Ave
- 200 Cheevers Ln
- 97-99 Englewood Ave