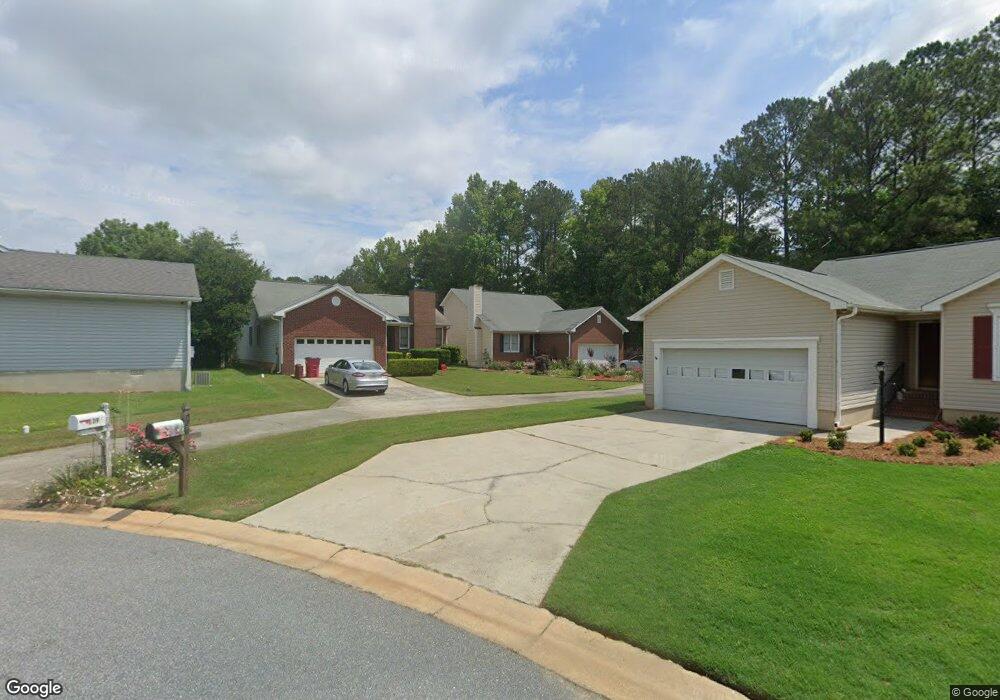
139 Wexford Ct Unit 17 Macon, GA 31210
Estimated Value: $177,000 - $250,000
3
Beds
3
Baths
1,902
Sq Ft
$112/Sq Ft
Est. Value
About This Home
This home is located at 139 Wexford Ct Unit 17, Macon, GA 31210 and is currently estimated at $213,718, approximately $112 per square foot. 139 Wexford Ct Unit 17 is a home located in Bibb County with nearby schools including Springdale Elementary School, Howard Middle School, and Howard High School.
Ownership History
Date
Name
Owned For
Owner Type
Purchase Details
Closed on
May 23, 2018
Sold by
Bass Donna J and Hahn Karen K
Bought by
Fumbah Gbegbe
Current Estimated Value
Home Financials for this Owner
Home Financials are based on the most recent Mortgage that was taken out on this home.
Original Mortgage
$124,450
Outstanding Balance
$106,925
Interest Rate
4.4%
Mortgage Type
New Conventional
Estimated Equity
$106,793
Purchase Details
Closed on
May 5, 2017
Sold by
Bass Donna J
Bought by
Bass Donna J and Kahn Karen K
Home Financials for this Owner
Home Financials are based on the most recent Mortgage that was taken out on this home.
Original Mortgage
$83,200
Interest Rate
4.1%
Mortgage Type
New Conventional
Purchase Details
Closed on
Oct 4, 2016
Sold by
Ditech Financial Llc
Bought by
Federal National Mtg Associati
Purchase Details
Closed on
Sep 26, 1992
Sold by
Hightower Dennis and Hightower Ruby W
Bought by
Creamer Patrick A and Creamer Naomi A
Create a Home Valuation Report for This Property
The Home Valuation Report is an in-depth analysis detailing your home's value as well as a comparison with similar homes in the area
Home Values in the Area
Average Home Value in this Area
Purchase History
| Date | Buyer | Sale Price | Title Company |
|---|---|---|---|
| Fumbah Gbegbe | $131,000 | None Available | |
| Bass Donna J | -- | None Available | |
| Bass Donna J | -- | -- | |
| Bass Donna J | $104,000 | -- | |
| Federal National Mtg Associati | $98,400 | -- | |
| Ditech Financial Llc | -- | -- | |
| Creamer Patrick A | $80,000 | -- |
Source: Public Records
Mortgage History
| Date | Status | Borrower | Loan Amount |
|---|---|---|---|
| Open | Fumbah Gbegbe | $124,450 | |
| Previous Owner | Bass Donna J | $83,200 |
Source: Public Records
Tax History Compared to Growth
Tax History
| Year | Tax Paid | Tax Assessment Tax Assessment Total Assessment is a certain percentage of the fair market value that is determined by local assessors to be the total taxable value of land and additions on the property. | Land | Improvement |
|---|---|---|---|---|
| 2025 | $1,524 | $62,012 | $8,000 | $54,012 |
| 2024 | $1,575 | $62,012 | $8,000 | $54,012 |
| 2023 | $1,575 | $62,012 | $8,000 | $54,012 |
| 2022 | $2,291 | $66,164 | $6,600 | $59,564 |
| 2021 | $2,235 | $58,815 | $6,600 | $52,215 |
| 2020 | $2,110 | $54,348 | $6,000 | $48,348 |
| 2019 | $1,900 | $48,546 | $6,000 | $42,546 |
| 2018 | $2,254 | $45,620 | $6,000 | $39,620 |
| 2017 | $1,931 | $51,536 | $8,000 | $43,536 |
| 2016 | $1,975 | $57,094 | $9,600 | $47,494 |
| 2015 | $2,796 | $57,094 | $9,600 | $47,494 |
| 2014 | $2,800 | $57,094 | $9,600 | $47,494 |
Source: Public Records
Map
Nearby Homes
- 178 Springfield Blvd
- 199 Springfield Blvd
- 150 Springdale Ct
- 5341 Northside Dr
- 115 Saddle Run Ct
- 108 Hillbrooke Ct
- 171 Lake View Dr N
- 123 Saddle Run Ct
- 1297 Wesleyan Dr
- 5369 Rivoli Dr
- 1231 Woodcrest Dr
- 5161 Wesleyan Cir
- 200 N Wesleyan Cir
- 181 Rivoli Landing
- 1643 Wesleyan Hills Dr
- 920 Wesleyan Dr
- 578 Edgefield Way
- 137 Senora Place
- 618 Millrun Ct
- 4964 Kathryn Dr
- 139 Wexford Ct
- 141 Wexford Ct
- 137 Wexford Ct
- 318 Ashville Ct
- 145 Wakefield Dr
- 135 Wexford Ct
- 147 Wakefield Dr
- 157 Foxford Ct
- 155 Foxford Ct
- 149 Wakefield Dr
- 314 Ashville Ct
- 321 Ashville Ct
- 153 Wakefield Dr
- 133 Wexford Ct
- 130 Springfield Blvd
- 131 Wexford Ct
- 159 Foxford Ct
- 129 Wexford Ct
- 310 Ashville Ct
- 134 Springfield Blvd