Estimated Value: $446,000 - $513,638
Studio
--
Bath
1,387
Sq Ft
$348/Sq Ft
Est. Value
About This Home
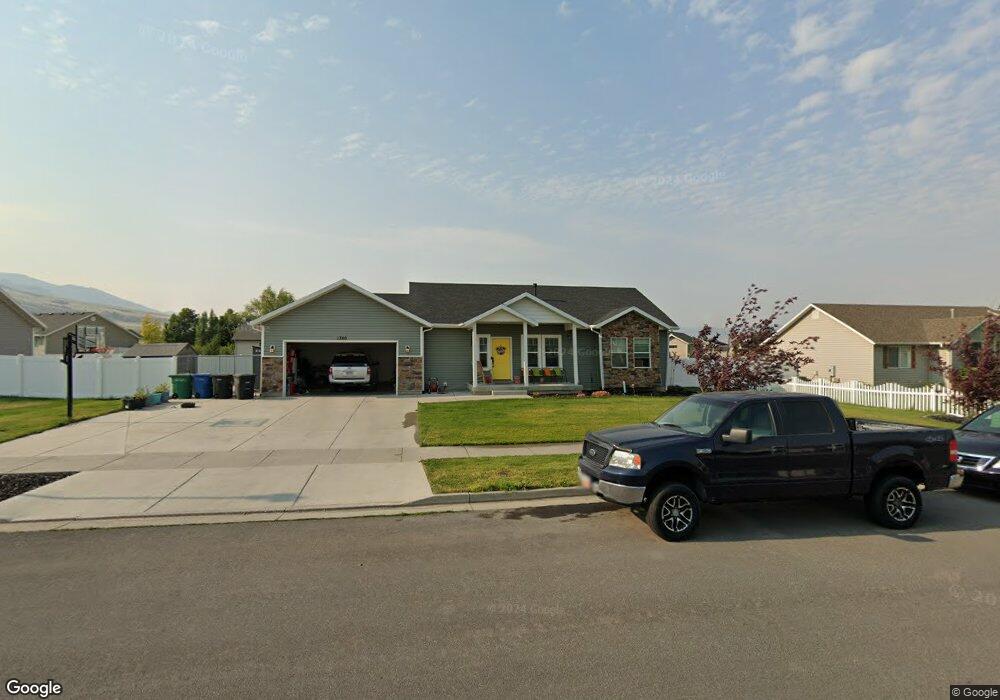
This home is located at 1390 E 150 S Unit 121, Hyrum, UT 84319 and is currently estimated at $482,410, approximately $347 per square foot. 1390 E 150 S Unit 121 is a home located in Cache County with nearby schools including Canyon School, South Cache Middle School, and Mountain Crest High School.
Ownership History
Date
Name
Owned For
Owner Type
Purchase Details
Closed on
Jun 7, 2019
Sold by
Lambert Jack B
Bought by
Jeppesen Larry D and Jeppesen Christine M
Current Estimated Value
Home Financials for this Owner
Home Financials are based on the most recent Mortgage that was taken out on this home.
Original Mortgage
$272,688
Outstanding Balance
$235,012
Interest Rate
3.37%
Mortgage Type
FHA
Estimated Equity
$247,398
Purchase Details
Closed on
Apr 23, 2018
Sold by
Bank Of Utah
Bought by
Lambert Jack B
Home Financials for this Owner
Home Financials are based on the most recent Mortgage that was taken out on this home.
Original Mortgage
$247,350
Interest Rate
4.46%
Mortgage Type
New Conventional
Purchase Details
Closed on
Dec 22, 2015
Sold by
Tibbitts Linda C
Bought by
Bank Of Utah and Leland Howlett Ira
Purchase Details
Closed on
Jan 30, 2014
Sold by
Mountain Valley Development Inc
Bought by
Tibbitts Linda C
Create a Home Valuation Report for This Property
The Home Valuation Report is an in-depth analysis detailing your home's value as well as a comparison with similar homes in the area
Home Values in the Area
Average Home Value in this Area
Purchase History
| Date | Buyer | Sale Price | Title Company |
|---|---|---|---|
| Jeppesen Larry D | -- | Investors Title Ins Agcy Inc | |
| Lambert Jack B | -- | Advanced Title | |
| Bank Of Utah | -- | Pinnacle Title | |
| Tibbitts Linda C | -- | Pinnacle Title Ins Agency |
Source: Public Records
Mortgage History
| Date | Status | Borrower | Loan Amount |
|---|---|---|---|
| Open | Jeppesen Larry D | $272,688 | |
| Previous Owner | Lambert Jack B | $247,350 |
Source: Public Records
Tax History
| Year | Tax Paid | Tax Assessment Tax Assessment Total Assessment is a certain percentage of the fair market value that is determined by local assessors to be the total taxable value of land and additions on the property. | Land | Improvement |
|---|---|---|---|---|
| 2025 | $1,985 | $284,970 | $0 | $0 |
| 2023 | $2,019 | $258,885 | $0 | $0 |
| 2022 | $2,107 | $258,885 | $0 | $0 |
| 2021 | $1,613 | $305,345 | $75,000 | $230,345 |
| 2020 | $1,550 | $275,300 | $75,000 | $200,300 |
| 2019 | $1,486 | $248,300 | $48,000 | $200,300 |
| 2018 | $1,067 | $172,300 | $48,000 | $124,300 |
| 2017 | $573 | $48,000 | $0 | $0 |
| 2016 | $586 | $48,000 | $0 | $0 |
| 2015 | $489 | $40,000 | $0 | $0 |
| 2014 | $478 | $40,000 | $0 | $0 |
| 2013 | $499 | $40,000 | $0 | $0 |
Source: Public Records
Map
Nearby Homes
Your Personal Tour Guide
Ask me questions while you tour the home.