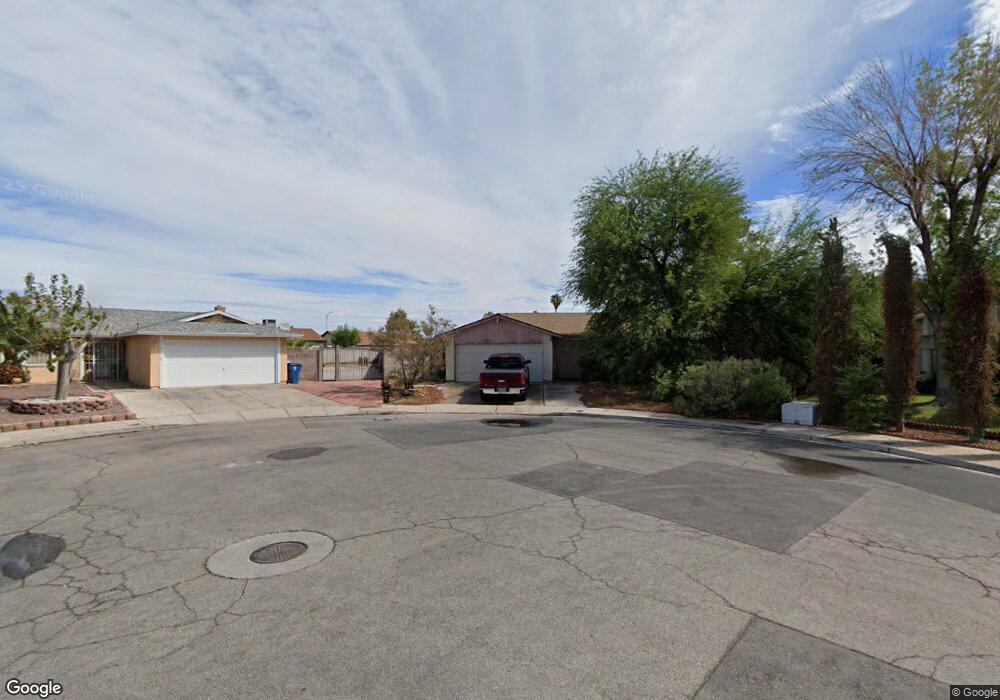
1390 Walnut Grove Ct Las Vegas, NV 89104
Estimated Value: $335,000 - $357,000
3
Beds
2
Baths
1,204
Sq Ft
$283/Sq Ft
Est. Value
About This Home
This home is located at 1390 Walnut Grove Ct, Las Vegas, NV 89104 and is currently estimated at $340,946, approximately $283 per square foot. 1390 Walnut Grove Ct is a home located in Clark County with nearby schools including Walter V. Long Elementary School, Jerome Mack Middle School, and Desert Pines High School.
Ownership History
Date
Name
Owned For
Owner Type
Purchase Details
Closed on
Apr 20, 2001
Sold by
Hud
Bought by
Keavin Kirsten Lynn
Current Estimated Value
Home Financials for this Owner
Home Financials are based on the most recent Mortgage that was taken out on this home.
Original Mortgage
$94,950
Outstanding Balance
$34,898
Interest Rate
6.98%
Mortgage Type
FHA
Estimated Equity
$306,048
Purchase Details
Closed on
Sep 12, 2000
Sold by
Nevada Housing Division
Bought by
Hud
Purchase Details
Closed on
Sep 5, 2000
Sold by
Delatorre Javier and Delatorre Shelley Renay
Bought by
Nevada Housing Division
Purchase Details
Closed on
Feb 20, 1997
Sold by
Rosario Valentine
Bought by
Delatorre Javier and Delatorre Shelley Renay
Home Financials for this Owner
Home Financials are based on the most recent Mortgage that was taken out on this home.
Original Mortgage
$100,409
Interest Rate
7.63%
Mortgage Type
FHA
Create a Home Valuation Report for This Property
The Home Valuation Report is an in-depth analysis detailing your home's value as well as a comparison with similar homes in the area
Home Values in the Area
Average Home Value in this Area
Purchase History
| Date | Buyer | Sale Price | Title Company |
|---|---|---|---|
| Keavin Kirsten Lynn | $106,000 | First American Title Co | |
| Hud | $108,721 | United Title | |
| Nevada Housing Division | $108,721 | Nevada Title Company | |
| Delatorre Javier | $101,500 | United Title |
Source: Public Records
Mortgage History
| Date | Status | Borrower | Loan Amount |
|---|---|---|---|
| Open | Keavin Kirsten Lynn | $94,950 | |
| Previous Owner | Delatorre Javier | $100,409 | |
| Closed | Keavin Kirsten Lynn | $53,000 |
Source: Public Records
Tax History Compared to Growth
Tax History
| Year | Tax Paid | Tax Assessment Tax Assessment Total Assessment is a certain percentage of the fair market value that is determined by local assessors to be the total taxable value of land and additions on the property. | Land | Improvement |
|---|---|---|---|---|
| 2025 | $1,666 | $56,607 | $32,760 | $23,847 |
| 2024 | $2,285 | $56,607 | $32,760 | $23,847 |
| 2023 | $2,285 | $59,383 | $35,700 | $23,683 |
| 2022 | $1,457 | $51,441 | $29,400 | $22,041 |
| 2021 | $1,917 | $46,601 | $25,200 | $21,401 |
| 2020 | $780 | $46,363 | $24,780 | $21,583 |
| 2019 | $771 | $44,752 | $23,100 | $21,652 |
| 2018 | $736 | $40,861 | $19,688 | $21,173 |
| 2017 | $1,253 | $42,733 | $21,000 | $21,733 |
| 2016 | $1,505 | $37,761 | $15,225 | $22,536 |
| 2015 | $939 | $32,089 | $11,550 | $20,539 |
| 2014 | $919 | $24,717 | $8,400 | $16,317 |
Source: Public Records
Map
Nearby Homes
- 4057 Olive St
- 4067 E Colorado Ave
- 3887 Delling Ct
- 4055 E New York Ave
- 4217 Park Ct
- 45 Prince Ln
- 3724 Lanai Ave
- 49 Del Amo Dr
- 1892 Miner Way
- 4201 Essex Green Ct
- 4213 Essex Green Ct
- 4280 Hampshire Green Ct
- 1601 S Sandhill Rd Unit 78
- 1601 S Sandhill Rd Unit 191
- 4237 Brockton Green Ct
- 62 Smith Squire Ct
- 4232 Brockton Green Ct
- 63 Harrison Rose Ct
- 89 Vallejo Ave
- 45 N Lamb Blvd
- 1406 Walnut Grove Ct
- 1373 Macon St
- 1373 Walnut Grove Ct
- 1389 Macon St Unit 24
- 1357 Macon St
- 3985 Arizona Ave
- 1405 Macon St
- 3973 Arizona Ave
- 1422 Walnut Grove Ct
- 3961 Arizona Ave
- 1341 Macon St
- 1421 Macon St
- 1389 Walnut Grove Ct
- 1405 Walnut Grove Ct
- 3949 Arizona Ave
- 1421 Walnut Grove Ct
- 4019 E Colorado Ave
- 3937 Arizona Ave
- 1390 Darling Ct
- 4020 Olive St