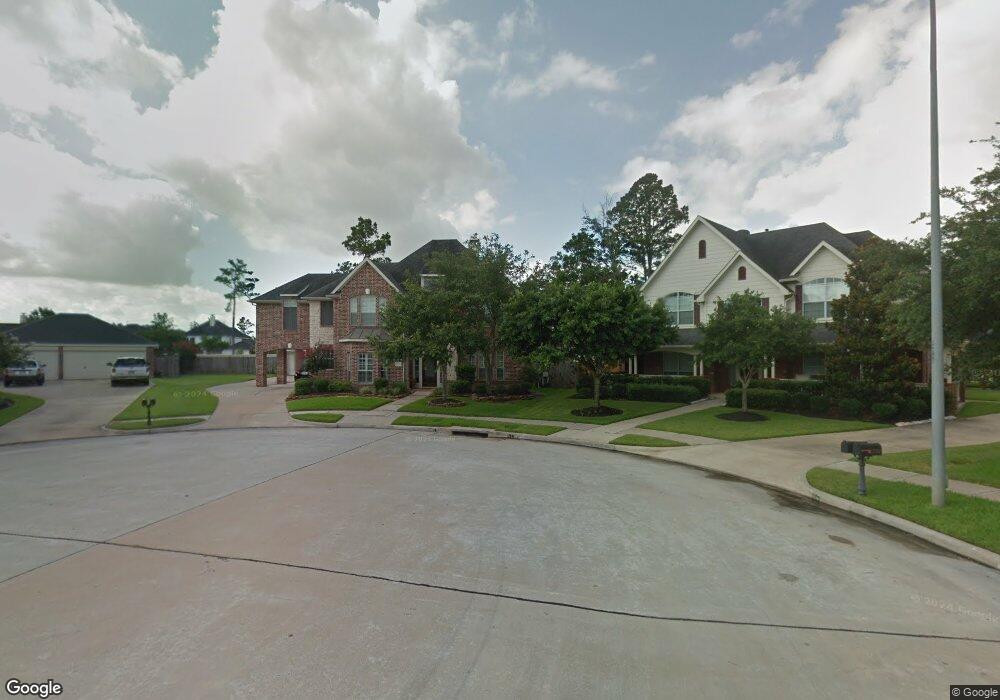
13902 Mount Airy Ct Cypress, TX 77429
Estimated Value: $568,000 - $625,049
3
Beds
3
Baths
4,022
Sq Ft
$150/Sq Ft
Est. Value
About This Home
This home is located at 13902 Mount Airy Ct, Cypress, TX 77429 and is currently estimated at $603,262, approximately $149 per square foot. 13902 Mount Airy Ct is a home located in Harris County with nearby schools including Sampson Elementary School, Spillane Middle School, and Cypress Woods High School.
Ownership History
Date
Name
Owned For
Owner Type
Purchase Details
Closed on
Oct 10, 2019
Sold by
Smith Vincent and Smith Kimberly S
Bought by
Smith Kimberly S
Current Estimated Value
Home Financials for this Owner
Home Financials are based on the most recent Mortgage that was taken out on this home.
Original Mortgage
$250,000
Outstanding Balance
$219,680
Interest Rate
3.65%
Mortgage Type
Stand Alone First
Estimated Equity
$383,582
Purchase Details
Closed on
May 2, 2002
Sold by
Tmi Inc
Bought by
Smith Vincent and Smith Kimberly S
Home Financials for this Owner
Home Financials are based on the most recent Mortgage that was taken out on this home.
Original Mortgage
$287,210
Interest Rate
7.19%
Purchase Details
Closed on
Oct 31, 2001
Sold by
Jdc/Greenleaf Ltd
Bought by
Centennial Homes Inc
Create a Home Valuation Report for This Property
The Home Valuation Report is an in-depth analysis detailing your home's value as well as a comparison with similar homes in the area
Home Values in the Area
Average Home Value in this Area
Purchase History
| Date | Buyer | Sale Price | Title Company |
|---|---|---|---|
| Smith Kimberly S | -- | Servicelink | |
| Smith Vincent | -- | Chicago Title Insurance Co | |
| Centennial Homes Inc | -- | Chicago Title |
Source: Public Records
Mortgage History
| Date | Status | Borrower | Loan Amount |
|---|---|---|---|
| Open | Smith Kimberly S | $250,000 | |
| Closed | Smith Vincent | $287,210 | |
| Closed | Smith Vincent | $35,901 |
Source: Public Records
Tax History Compared to Growth
Tax History
| Year | Tax Paid | Tax Assessment Tax Assessment Total Assessment is a certain percentage of the fair market value that is determined by local assessors to be the total taxable value of land and additions on the property. | Land | Improvement |
|---|---|---|---|---|
| 2025 | $8,928 | $538,204 | $111,763 | $426,441 |
| 2024 | $8,928 | $580,621 | $101,646 | $478,975 |
| 2023 | $8,928 | $580,621 | $101,646 | $478,975 |
| 2022 | $10,786 | $523,484 | $72,742 | $450,742 |
| 2021 | $10,414 | $411,459 | $72,742 | $338,717 |
| 2020 | $10,356 | $396,888 | $59,022 | $337,866 |
| 2019 | $10,508 | $390,520 | $59,022 | $331,498 |
| 2018 | $4,143 | $390,849 | $59,022 | $331,827 |
| 2017 | $10,519 | $390,849 | $59,022 | $331,827 |
| 2016 | $10,519 | $390,849 | $59,022 | $331,827 |
| 2015 | $8,230 | $390,849 | $59,022 | $331,827 |
| 2014 | $8,230 | $390,849 | $59,022 | $331,827 |
Source: Public Records
Map
Nearby Homes
- 13718 Sherburn Manor Dr
- 15923 Hurstfield Pointe Dr
- 14103 Sherburn Manor Dr
- 16219 Haden Crest Ct
- 16211 Halpren Falls Ln
- 14210 Prospect Point Dr
- 14126 Bloomingdale Manor Dr
- 13002 Huffmeister Rd
- 15922 Clipper Pointe Dr
- 13703 Layton Hills Dr
- 13926 Wessex Park Dr
- 16306 Bontura St
- 13611 Monteigne Ln
- 16322 Bontura St
- 13014 Vivienne Westmoreland Dr
- 16406 Haden Crest Ct
- 14314 Prosper Ridge Dr
- 14210 Northface Manor Ct
- 14207 Spindle Arbor Rd
- 14442 Gleaming Rose Dr
- 13903 Mount Airy Ct
- 13906 Mount Airy Ct
- 13910 Mount Airy Ct
- 13907 Mount Airy Ct
- 13902 Cantrell Manor
- 13906 Cantrelle Manor Ln
- 13906 Cantrell Manor
- 16039 Lockdale Ln
- 16007 Lockdale Ln
- 13914 Mount Airy Ct
- 13914 Cantrelle Manor Ln
- 13823 Sherburn Manor Dr
- 13914 Cantrell Manor
- 13819 Sherburn Manor Dr
- 16003 Lockdale Ln
- 13827 Sherburn Manor Dr
- 16043 Lockdale Ln
- 13815 Sherburn Manor Dr
- 13918 Cantrell Manor
- 13831 Sherburn Manor Dr