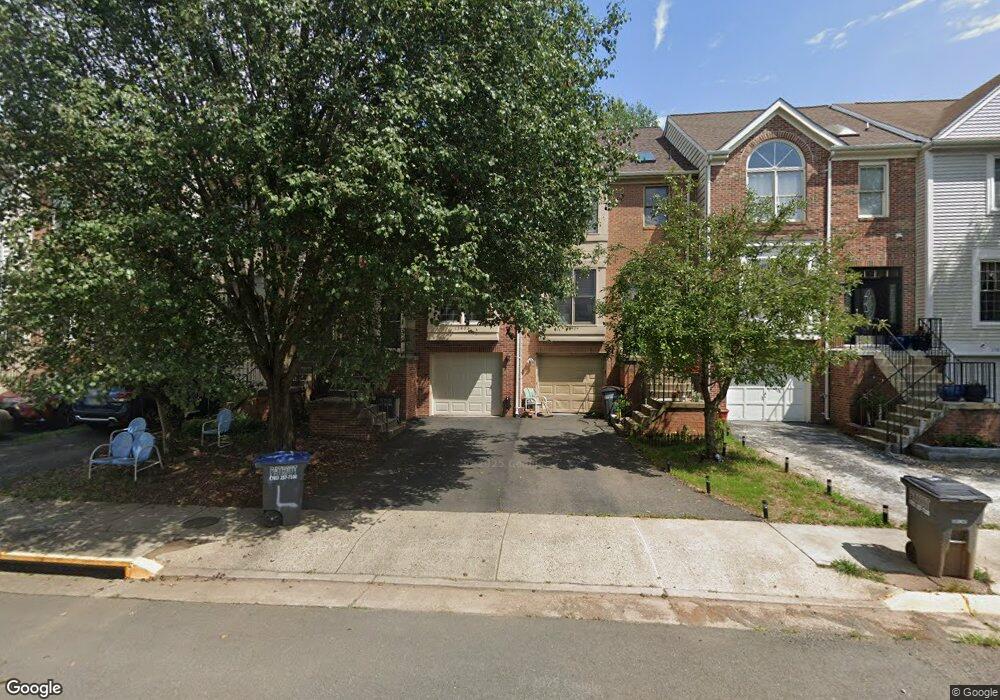
13906 Baton Rouge Ct Centreville, VA 20121
Estimated Value: $548,000 - $564,000
3
Beds
4
Baths
1,320
Sq Ft
$420/Sq Ft
Est. Value
About This Home
This home is located at 13906 Baton Rouge Ct, Centreville, VA 20121 and is currently estimated at $554,771, approximately $420 per square foot. 13906 Baton Rouge Ct is a home located in Fairfax County with nearby schools including Centreville Elementary School, Liberty Middle School, and Centreville High School.
Ownership History
Date
Name
Owned For
Owner Type
Purchase Details
Closed on
Jan 9, 2020
Sold by
Lawrence Paul J and Hambley Sherry A
Bought by
Lawrence Sherry H
Current Estimated Value
Home Financials for this Owner
Home Financials are based on the most recent Mortgage that was taken out on this home.
Original Mortgage
$363,719
Outstanding Balance
$319,146
Interest Rate
3.25%
Mortgage Type
VA
Estimated Equity
$235,625
Purchase Details
Closed on
Mar 5, 2002
Sold by
Groff Laura J
Bought by
Lawrence Paul J
Home Financials for this Owner
Home Financials are based on the most recent Mortgage that was taken out on this home.
Original Mortgage
$227,868
Interest Rate
7.01%
Mortgage Type
VA
Purchase Details
Closed on
Sep 16, 1996
Sold by
Phan Phuong T
Bought by
Groff Laura J
Home Financials for this Owner
Home Financials are based on the most recent Mortgage that was taken out on this home.
Original Mortgage
$111,750
Interest Rate
8.18%
Create a Home Valuation Report for This Property
The Home Valuation Report is an in-depth analysis detailing your home's value as well as a comparison with similar homes in the area
Home Values in the Area
Average Home Value in this Area
Purchase History
| Date | Buyer | Sale Price | Title Company |
|---|---|---|---|
| Lawrence Sherry H | $97,049 | Amrock Inc | |
| Lawrence Paul J | $223,400 | -- | |
| Groff Laura J | $149,000 | -- |
Source: Public Records
Mortgage History
| Date | Status | Borrower | Loan Amount |
|---|---|---|---|
| Open | Lawrence Sherry H | $363,719 | |
| Previous Owner | Lawrence Paul J | $227,868 | |
| Previous Owner | Groff Laura J | $111,750 | |
| Closed | Groff Laura J | $22,350 |
Source: Public Records
Tax History Compared to Growth
Tax History
| Year | Tax Paid | Tax Assessment Tax Assessment Total Assessment is a certain percentage of the fair market value that is determined by local assessors to be the total taxable value of land and additions on the property. | Land | Improvement |
|---|---|---|---|---|
| 2025 | $5,549 | $538,740 | $170,000 | $368,740 |
| 2024 | $5,549 | $479,000 | $140,000 | $339,000 |
| 2023 | $5,333 | $472,550 | $140,000 | $332,550 |
| 2022 | $4,974 | $434,980 | $130,000 | $304,980 |
| 2021 | $4,700 | $400,500 | $115,000 | $285,500 |
| 2020 | $4,507 | $380,840 | $110,000 | $270,840 |
| 2019 | $4,271 | $360,860 | $100,000 | $260,860 |
| 2018 | $4,095 | $356,090 | $100,000 | $256,090 |
| 2017 | $3,879 | $334,130 | $90,000 | $244,130 |
| 2016 | $3,780 | $326,300 | $85,000 | $241,300 |
| 2015 | $3,642 | $326,300 | $85,000 | $241,300 |
| 2014 | $3,423 | $307,430 | $80,000 | $227,430 |
Source: Public Records
Map
Nearby Homes
- 6316 Mary Todd Ln
- 14102 Autumn Cir
- 14159 Autumn Cir
- 6309 Trevilian Place
- 6311 Betsy Ross Ct
- 6218 Stonehunt Place
- 14079 Red River Dr
- 6488 Palisades Dr
- 14005C Grumble Jones Ct
- 14158 Darkwood Cir
- 14146 Red River Dr
- 14000 Grumble Jones Ct Unit B
- 13906 Big Yankee Ln
- 13875 Laura Ratcliff Ct
- 6605 English Saddle Ct
- 13813 Foggy Hills Ct
- 13633 Union Village Cir
- 14002C Walter Bowie Ln
- 13910 Stonefield Ln
- 13975 Tanners House Way
- 13904 Baton Rouge Ct
- 13902 Baton Rouge Ct
- 13910 Baton Rouge Ct
- 13912 Baton Rouge Ct
- 13900 Baton Rouge Ct
- 13914 Baton Rouge Ct
- 13917 Baton Rouge Ct
- 13919 Baton Rouge Ct
- 13916 Baton Rouge Ct
- 13921 Baton Rouge Ct
- 13918 Baton Rouge Ct
- 13923 Baton Rouge Ct
- 13922 Baton Rouge Ct
- 13925 Baton Rouge Ct
- 13924 Baton Rouge Ct
- 13927 Baton Rouge Ct
- 13926 Baton Rouge Ct
- 13900 Green Trails Ct
- 13929 Baton Rouge Ct
- 13928 Baton Rouge Ct