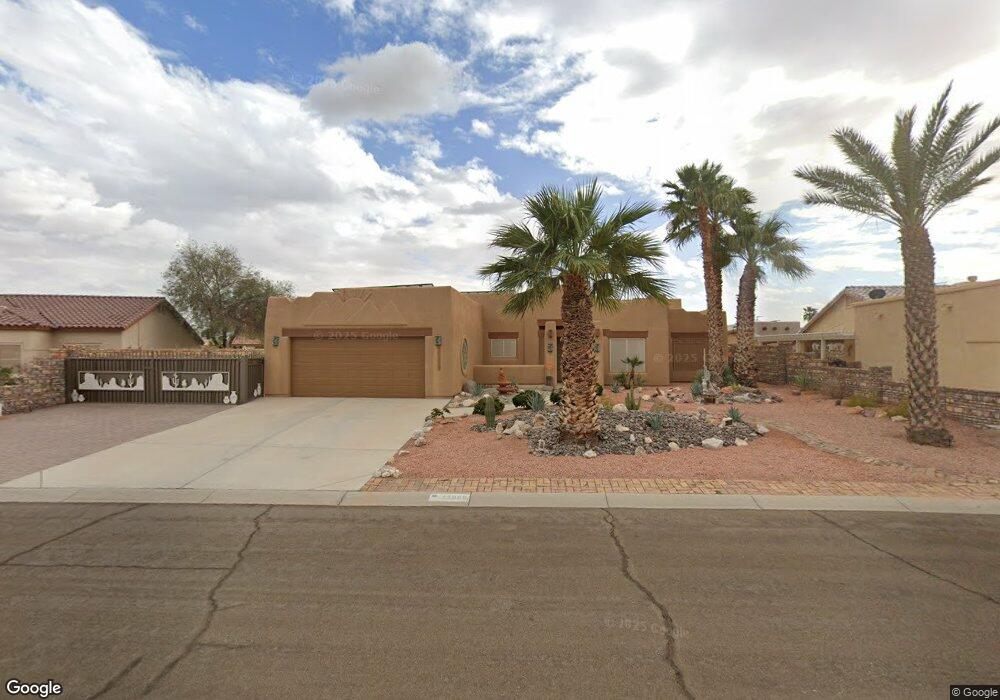
13909 E 53rd Ln Yuma, AZ 85367
Fortuna Foothills NeighborhoodEstimated Value: $387,165 - $486,000
3
Beds
2
Baths
1,621
Sq Ft
$272/Sq Ft
Est. Value
About This Home
This home is located at 13909 E 53rd Ln, Yuma, AZ 85367 and is currently estimated at $441,291, approximately $272 per square foot. 13909 E 53rd Ln is a home located in Yuma County with nearby schools including Mary A. Otondo Elementary School, Ron Watson Middle School, and Gila Ridge High School.
Ownership History
Date
Name
Owned For
Owner Type
Purchase Details
Closed on
Sep 20, 2012
Sold by
Ellis Darrel L and Ellis Lesley Jo
Bought by
Ellis Darrel L and Ellis Lesley Jo
Current Estimated Value
Purchase Details
Closed on
Oct 27, 2011
Sold by
Hallman Janelle Marie and Winzeler Frank J
Bought by
Ellis Darrel L and Ellis Lesley J
Home Financials for this Owner
Home Financials are based on the most recent Mortgage that was taken out on this home.
Original Mortgage
$65,000
Outstanding Balance
$42,162
Interest Rate
4.02%
Mortgage Type
New Conventional
Estimated Equity
$399,129
Purchase Details
Closed on
Jun 8, 1999
Sold by
T D G Marketing Inc
Bought by
Winzeler Frank J and Winzeler Margo Z
Purchase Details
Closed on
Jun 7, 1999
Sold by
T D G Inc
Bought by
T D G Marketing Inc
Purchase Details
Closed on
Dec 10, 1998
Sold by
Citizens Title & Trust
Bought by
T D G Inc
Create a Home Valuation Report for This Property
The Home Valuation Report is an in-depth analysis detailing your home's value as well as a comparison with similar homes in the area
Home Values in the Area
Average Home Value in this Area
Purchase History
| Date | Buyer | Sale Price | Title Company |
|---|---|---|---|
| Ellis Darrel L | -- | None Available | |
| Ellis Darrel L | -- | None Available | |
| Ellis Darrel L | $208,000 | Title Security | |
| Winzeler Frank J | $125,200 | Citizens Title | |
| T D G Marketing Inc | -- | Citizens Title | |
| T D G Inc | $21,000 | Citizens Title |
Source: Public Records
Mortgage History
| Date | Status | Borrower | Loan Amount |
|---|---|---|---|
| Open | Ellis Darrel L | $65,000 |
Source: Public Records
Tax History
| Year | Tax Paid | Tax Assessment Tax Assessment Total Assessment is a certain percentage of the fair market value that is determined by local assessors to be the total taxable value of land and additions on the property. | Land | Improvement |
|---|---|---|---|---|
| 2026 | $1,890 | $24,035 | $5,663 | $18,372 |
| 2025 | $1,831 | $22,891 | $5,253 | $17,638 |
| 2024 | $1,811 | $21,800 | $4,969 | $16,831 |
| 2023 | $1,811 | $20,763 | $4,750 | $16,013 |
| 2022 | $1,741 | $19,774 | $4,650 | $15,124 |
| 2021 | $1,901 | $19,034 | $4,000 | $15,034 |
| 2020 | $1,767 | $18,720 | $3,800 | $14,920 |
| 2019 | $1,790 | $18,259 | $4,025 | $14,234 |
| 2018 | $1,760 | $17,915 | $3,861 | $14,054 |
| 2017 | $1,682 | $17,915 | $3,861 | $14,054 |
| 2016 | $1,812 | $16,908 | $4,700 | $12,208 |
| 2015 | $1,588 | $16,116 | $4,950 | $11,166 |
| 2014 | $1,588 | $16,687 | $5,000 | $11,687 |
Source: Public Records
Map
Nearby Homes
- 13211 E 54th St
- 13902 E 53rd Dr
- 13781 E 53rd Ln
- 13424 E 52nd Dr
- 14141 E 52nd St
- 13635 E 52nd St
- 13854 E 52nd St
- 13824 E 52nd St
- 13642 Chase Way
- 13764 S Chase Way
- 14187 E 51st Place
- 14347 E 55th St
- 14155 E 51st St
- 13615 E 53rd Dr
- 13641 E 52nd Dr
- 14406 E 53 Ln
- 14406 E 53rd Ln
- 13672 E 55 Ln
- 14407 E 53 Ln
- 14401 E 53rd St
- 13899 E 53rd Ln
- 13923 E 53rd Ln
- 13910 E 54th St
- 13900 E 54th St
- 13924 E 54th St
- 13912 E 53rd Ln
- 13885 E 53rd Ln
- 13898 E 53rd Ln
- 13886 E 54th St
- 13928 E 53rd Ln
- 13940 E 54th St
- 13937 E 53rd Ln
- 13886 E 53rd Ln
- 138150 E 54th St
- 13876 E 54th St
- 13913 E 53rd Dr
- 13901 E 53rd Dr
- 13956 E 54th St
- 13874 E 53rd Ln
- 13905 E 54th St
Your Personal Tour Guide
Ask me questions while you tour the home.