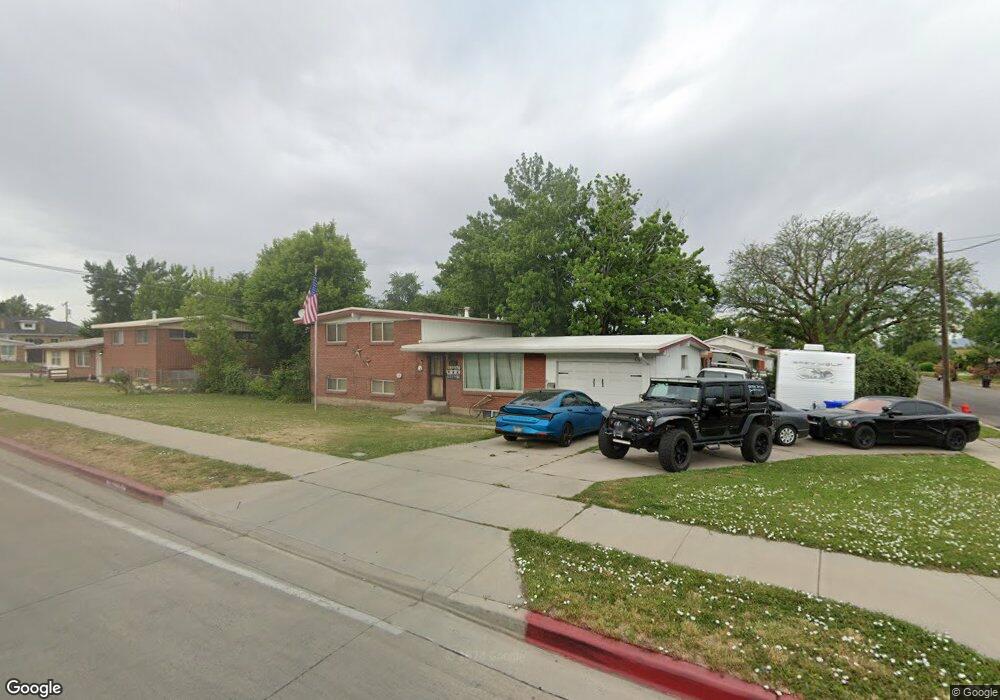
1391 N 200 W Bountiful, UT 84010
Estimated Value: $488,000 - $525,535
5
Beds
2
Baths
1,100
Sq Ft
$467/Sq Ft
Est. Value
About This Home
This home is located at 1391 N 200 W, Bountiful, UT 84010 and is currently estimated at $513,384, approximately $466 per square foot. 1391 N 200 W is a home located in Davis County with nearby schools including Meadowbrook Elementary School, Bountiful Junior High School, and Viewmont High School.
Ownership History
Date
Name
Owned For
Owner Type
Purchase Details
Closed on
Nov 20, 2018
Sold by
Parker Thomas K and Thomson Desirae
Bought by
Parker Thomas K and Parker Desirae
Current Estimated Value
Home Financials for this Owner
Home Financials are based on the most recent Mortgage that was taken out on this home.
Original Mortgage
$181,929
Outstanding Balance
$113,542
Interest Rate
4.37%
Mortgage Type
FHA
Estimated Equity
$399,842
Purchase Details
Closed on
Aug 20, 2009
Sold by
Thomson Desirae
Bought by
Parker Thomas K and Thomson Desirae
Purchase Details
Closed on
Apr 2, 2004
Sold by
Hill Theresa
Bought by
Thomson Desirae
Home Financials for this Owner
Home Financials are based on the most recent Mortgage that was taken out on this home.
Original Mortgage
$116,000
Interest Rate
6.75%
Mortgage Type
Purchase Money Mortgage
Purchase Details
Closed on
May 25, 2001
Sold by
Demarco Louie George and Demarco Dora Larae
Bought by
Demarco Larae and Demarco Louie G
Create a Home Valuation Report for This Property
The Home Valuation Report is an in-depth analysis detailing your home's value as well as a comparison with similar homes in the area
Purchase History
| Date | Buyer | Sale Price | Title Company |
|---|---|---|---|
| Parker Thomas K | -- | Servicelink East E | |
| Parker Thomas K | -- | Accommodation | |
| Thomson Desirae | -- | Pinnacle Title | |
| Demarco Larae | -- | -- |
Source: Public Records
Mortgage History
| Date | Status | Borrower | Loan Amount |
|---|---|---|---|
| Open | Parker Thomas K | $181,929 | |
| Closed | Thomson Desirae | $116,000 |
Source: Public Records
Tax History
| Year | Tax Paid | Tax Assessment Tax Assessment Total Assessment is a certain percentage of the fair market value that is determined by local assessors to be the total taxable value of land and additions on the property. | Land | Improvement |
|---|---|---|---|---|
| 2025 | $2,768 | $250,250 | $122,394 | $127,856 |
| 2024 | $2,570 | $241,450 | $108,400 | $133,050 |
| 2023 | $2,587 | $417,000 | $200,363 | $216,637 |
| 2022 | $2,575 | $222,200 | $109,660 | $112,540 |
| 2021 | $2,203 | $314,000 | $143,475 | $170,525 |
| 2020 | $1,934 | $276,000 | $122,795 | $153,205 |
| 2019 | $2,134 | $274,000 | $131,293 | $142,707 |
| 2018 | $1,920 | $248,000 | $128,735 | $119,265 |
| 2016 | $1,538 | $113,850 | $52,930 | $60,920 |
| 2015 | $1,493 | $104,280 | $52,930 | $51,350 |
| 2014 | $1,466 | $96,802 | $52,930 | $43,872 |
| 2013 | -- | $96,094 | $34,381 | $61,713 |
Source: Public Records
Map
Nearby Homes
- 235 W 1400 N
- 1260 N 200 W
- 1130 N 200 W
- 366 W 1000 N
- 328 W Pages Ln
- 1625 Pages Place
- 184 Park Shadows Cir
- 951 Centerville Commons Way
- 1520 N 550 W
- 96 Village Square Rd
- 204 Lyman Ln
- 1420 N Main St
- 106 W 700 N
- 563 N 200 W
- 214 E 1250 N
- 16 W 780 S
- 499 N 200 W Unit 30
- 967 S Courtyard Ln
- 150 E 735 S Unit 23
- 462 Pitford Dr
Your Personal Tour Guide
Ask me questions while you tour the home.