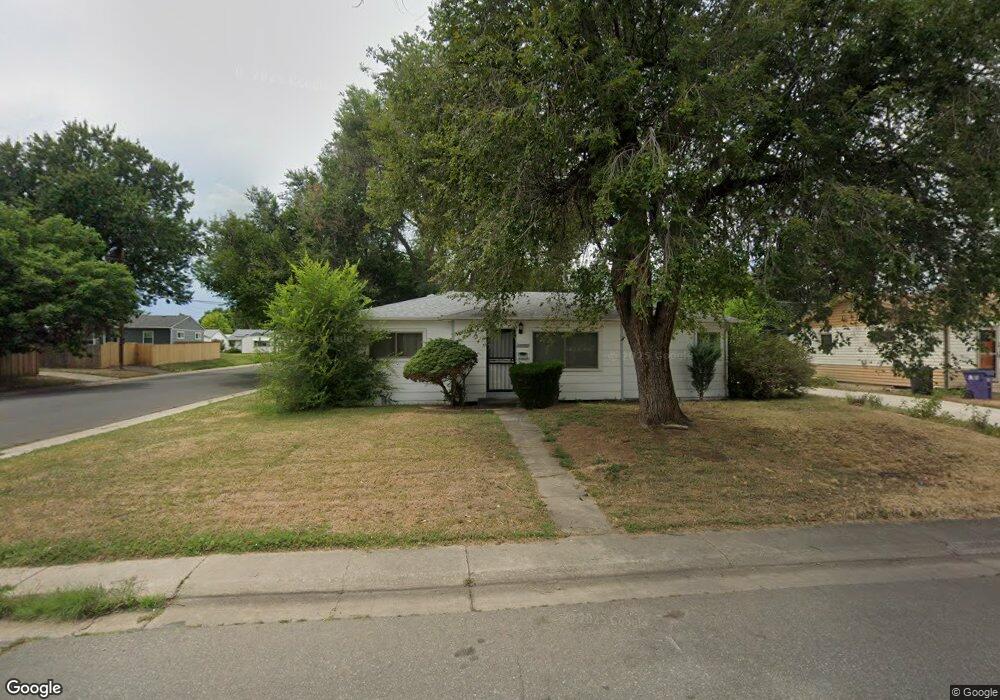
1391 S Patton Ct Denver, CO 80219
Mar Lee NeighborhoodEstimated Value: $408,957 - $477,000
3
Beds
1
Bath
1,109
Sq Ft
$407/Sq Ft
Est. Value
About This Home
This home is located at 1391 S Patton Ct, Denver, CO 80219 and is currently estimated at $451,489, approximately $407 per square foot. 1391 S Patton Ct is a home located in Denver County with nearby schools including Force Elementary School, Kepner Beacon Middle School, and John F Kennedy High School.
Ownership History
Date
Name
Owned For
Owner Type
Purchase Details
Closed on
Apr 28, 1995
Sold by
Fesker Richard C
Bought by
Reyna Hugo F and Reyna Maricruz
Current Estimated Value
Home Financials for this Owner
Home Financials are based on the most recent Mortgage that was taken out on this home.
Original Mortgage
$97,802
Interest Rate
8.33%
Mortgage Type
FHA
Purchase Details
Closed on
Mar 17, 1995
Sold by
Schlundt Harold and Schlundt Elsie I
Bought by
Fesker Richard C and D W Real Estate Investors Inc
Home Financials for this Owner
Home Financials are based on the most recent Mortgage that was taken out on this home.
Original Mortgage
$97,802
Interest Rate
8.33%
Mortgage Type
FHA
Purchase Details
Closed on
Apr 29, 1994
Sold by
Schlundt Steven A and Schlundt Colleen M
Bought by
Schlundt Harold and Schlundt Elsie I
Home Financials for this Owner
Home Financials are based on the most recent Mortgage that was taken out on this home.
Original Mortgage
$44,500
Interest Rate
8.03%
Create a Home Valuation Report for This Property
The Home Valuation Report is an in-depth analysis detailing your home's value as well as a comparison with similar homes in the area
Home Values in the Area
Average Home Value in this Area
Purchase History
| Date | Buyer | Sale Price | Title Company |
|---|---|---|---|
| Reyna Hugo F | $98,500 | Land Title | |
| Fesker Richard C | $76,000 | Land Title | |
| Schlundt Harold | -- | -- |
Source: Public Records
Mortgage History
| Date | Status | Borrower | Loan Amount |
|---|---|---|---|
| Closed | Reyna Hugo F | $97,802 | |
| Previous Owner | Schlundt Harold | $44,500 |
Source: Public Records
Tax History Compared to Growth
Tax History
| Year | Tax Paid | Tax Assessment Tax Assessment Total Assessment is a certain percentage of the fair market value that is determined by local assessors to be the total taxable value of land and additions on the property. | Land | Improvement |
|---|---|---|---|---|
| 2024 | $2,015 | $25,440 | $1,460 | $23,980 |
| 2023 | $1,971 | $25,440 | $1,460 | $23,980 |
| 2022 | $1,775 | $22,320 | $5,340 | $16,980 |
| 2021 | $1,713 | $22,960 | $5,490 | $17,470 |
| 2020 | $1,559 | $21,010 | $5,490 | $15,520 |
| 2019 | $1,515 | $21,010 | $5,490 | $15,520 |
| 2018 | $1,325 | $17,130 | $4,150 | $12,980 |
| 2017 | $1,321 | $17,130 | $4,150 | $12,980 |
| 2016 | $1,007 | $12,350 | $4,330 | $8,020 |
| 2015 | $965 | $12,350 | $4,330 | $8,020 |
| 2014 | $684 | $8,230 | $2,547 | $5,683 |
Source: Public Records
Map
Nearby Homes
- 419 S Osceola St
- 415 S Osceola St
- 405 S Osceola St
- 1381 S Perry St
- 1470 S Quitman St
- 1361 S Perry St
- 1532 S Quitman St
- 364 S Newton St
- 1561 S Patton Ct
- 1562 S Osceola Way
- 1431 S Meade St
- 1255 S Patton Ct
- 990 S Meade St
- 1624 S Patton Ct
- 995 S Lowell Blvd
- 1589 S Michigan Way
- 1455 S Tennyson St
- 1200 S Patton Ct
- 1637 S Quitman St
- 1651 S Perry St
- 1381 S Patton Ct
- 1390 S Perry St
- 1371 S Patton Ct
- 1405 S Patton Ct
- 1380 S Perry St
- 1392 S Patton Ct
- 1380 S Patton Ct
- 1415 S Patton Ct
- 1408 S Perry St
- 1361 S Patton Ct
- 1374 S Patton Ct
- 1400 S Patton Ct
- 0 S Perry St
- 1370 S Perry St
- 1418 S Perry St
- 1425 S Patton Ct
- 1410 S Patton Ct
- 1351 S Patton Ct
- 1360 S Perry St
- 1428 S Perry St