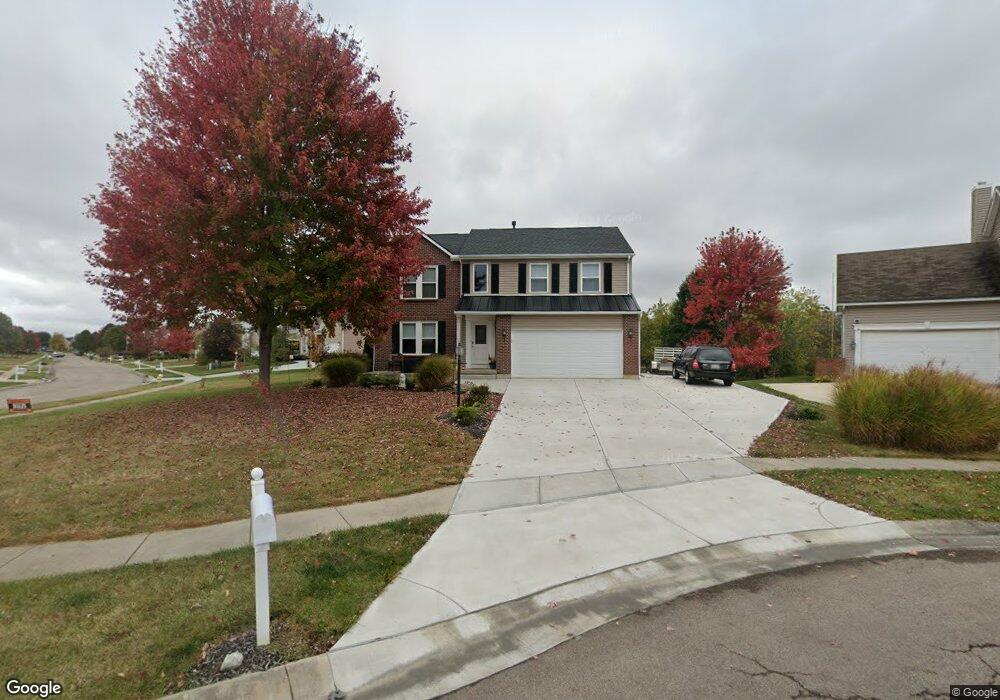
1392 Backstretch Ct Dayton, OH 45434
Estimated Value: $391,552 - $447,000
4
Beds
3
Baths
1,996
Sq Ft
$208/Sq Ft
Est. Value
About This Home
This home is located at 1392 Backstretch Ct, Dayton, OH 45434 and is currently estimated at $415,388, approximately $208 per square foot. 1392 Backstretch Ct is a home located in Greene County with nearby schools including Trebein Elementary School, Jacob Coy Middle School, and Beavercreek High School.
Ownership History
Date
Name
Owned For
Owner Type
Purchase Details
Closed on
Apr 5, 2017
Sold by
Bales Joshua A
Bought by
Vanwert David C and Van Wert Kristen J
Current Estimated Value
Home Financials for this Owner
Home Financials are based on the most recent Mortgage that was taken out on this home.
Original Mortgage
$232,750
Outstanding Balance
$190,898
Interest Rate
4.21%
Mortgage Type
New Conventional
Estimated Equity
$224,490
Purchase Details
Closed on
Mar 14, 2014
Sold by
Bales Wendy S
Bought by
Bales Joshua A
Purchase Details
Closed on
Sep 23, 2005
Sold by
Nvr Inc
Bought by
Bales Joshua A and Bales Wendy S
Home Financials for this Owner
Home Financials are based on the most recent Mortgage that was taken out on this home.
Original Mortgage
$188,976
Interest Rate
6.25%
Mortgage Type
Fannie Mae Freddie Mac
Purchase Details
Closed on
Jun 23, 2005
Sold by
Ajv Development Llc
Bought by
Nvr Inc
Create a Home Valuation Report for This Property
The Home Valuation Report is an in-depth analysis detailing your home's value as well as a comparison with similar homes in the area
Home Values in the Area
Average Home Value in this Area
Purchase History
| Date | Buyer | Sale Price | Title Company |
|---|---|---|---|
| Vanwert David C | $145,000 | None Available | |
| Bales Joshua A | -- | None Available | |
| Bales Joshua A | $236,300 | First Title Agency | |
| Nvr Inc | $54,100 | First Title Agency Inc |
Source: Public Records
Mortgage History
| Date | Status | Borrower | Loan Amount |
|---|---|---|---|
| Open | Vanwert David C | $232,750 | |
| Previous Owner | Bales Joshua A | $188,976 |
Source: Public Records
Tax History
| Year | Tax Paid | Tax Assessment Tax Assessment Total Assessment is a certain percentage of the fair market value that is determined by local assessors to be the total taxable value of land and additions on the property. | Land | Improvement |
|---|---|---|---|---|
| 2025 | $6,205 | $106,860 | $21,240 | $85,620 |
| 2024 | $6,205 | $106,860 | $21,240 | $85,620 |
| 2023 | $6,137 | $106,860 | $21,240 | $85,620 |
| 2022 | $5,480 | $83,660 | $16,990 | $66,670 |
| 2021 | $5,535 | $83,660 | $16,990 | $66,670 |
| 2020 | $5,561 | $83,660 | $16,990 | $66,670 |
| 2019 | $5,461 | $75,370 | $12,510 | $62,860 |
| 2018 | $4,770 | $75,500 | $12,510 | $62,990 |
| 2017 | $4,689 | $75,500 | $12,510 | $62,990 |
| 2016 | $4,459 | $69,480 | $12,510 | $56,970 |
| 2015 | $4,487 | $69,480 | $12,510 | $56,970 |
| 2014 | $4,277 | $69,480 | $12,510 | $56,970 |
Source: Public Records
Map
Nearby Homes
- 1260 Camden Trace
- 2331 Eastwind Dr
- 1514 View Point Dr
- 2331 Wedgewood Dr
- 1446 Long Island Ct
- 1565 Kingsway Dr
- 2267 Old Post Rd
- 1101 Westover Rd
- 1608 Windham Ln
- 1073 Forest Dr
- 895 Alpha Rd
- 2282 Whitey Marshall Dr
- 1149 Asbury Ct
- 1613 Stonebury Ct
- 1482 Runnymeade Way
- 1445 Runnymeade Way
- 2131 Schmidt Dr W
- 1413 Runnymeade Way
- 1957 John Bull W
- 2418 Owen Cir W
- 1388 Backstretch Ct
- 1966 Pacer Trail
- 1955 Pacer Trail
- 1976 Pacer Trail
- 1384 Backstretch Ct
- 2079 Raceway Trail
- 1975 Pacer Trail
- 1381 Backstretch Ct
- 1980 Pacer Trail
- 2088 Raceway Trail
- 2087 Raceway Trail
- 1375 Bareback Trail
- 1984 Pacer Trail
- 2094 Raceway Trail
- 1372 Bareback Trail
- 2064 Lincolnshire Dr
- 2095 Raceway Trail
- 1379 Bareback Trail
- 2056 Lincolnshire Dr
- 2072 Lincolnshire Dr
Your Personal Tour Guide
Ask me questions while you tour the home.