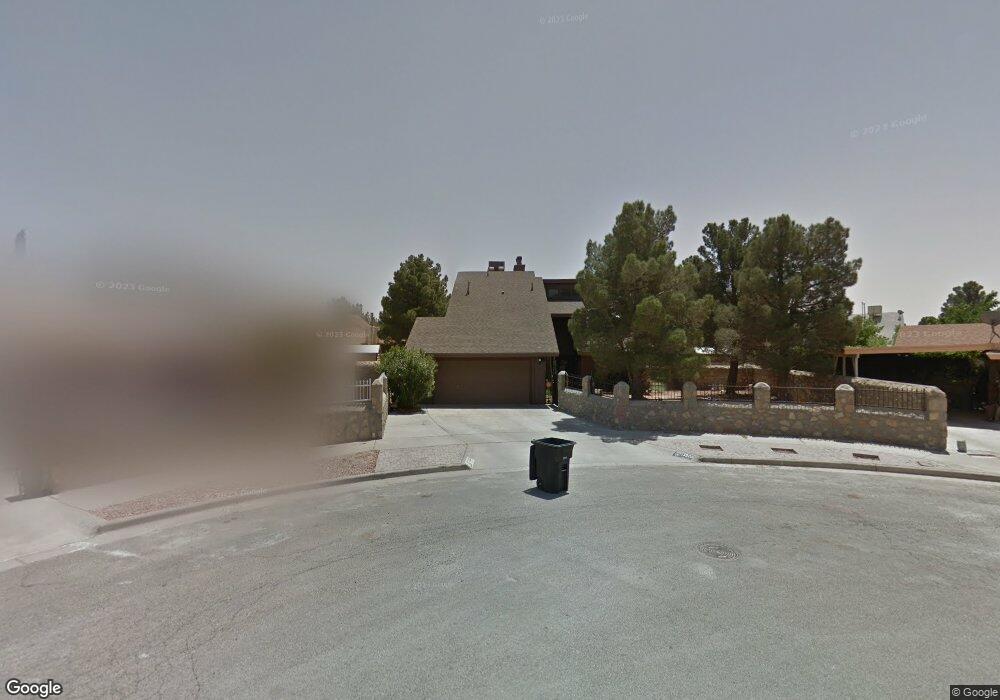
13920 Pete La Rue Cir Horizon City, TX 79928
Estimated Value: $259,000 - $276,509
3
Beds
2
Baths
1,935
Sq Ft
$139/Sq Ft
Est. Value
About This Home
This home is located at 13920 Pete La Rue Cir, Horizon City, TX 79928 and is currently estimated at $268,627, approximately $138 per square foot. 13920 Pete La Rue Cir is a home located in El Paso County with nearby schools including Horizon Heights Elementary School, Col. John O. Ensor Middle School, and Eastlake High School.
Ownership History
Date
Name
Owned For
Owner Type
Purchase Details
Closed on
Jun 22, 2009
Sold by
Osmond Kenneth W and Osmond Donna E
Bought by
Salaiz Rudy G
Current Estimated Value
Home Financials for this Owner
Home Financials are based on the most recent Mortgage that was taken out on this home.
Original Mortgage
$164,795
Outstanding Balance
$104,065
Interest Rate
4.84%
Mortgage Type
Purchase Money Mortgage
Estimated Equity
$164,562
Purchase Details
Closed on
Aug 11, 1995
Sold by
Frazier Stephen L and Frazier Jo Ann A
Bought by
Osmond Kenneth W and Osmond Donna E
Home Financials for this Owner
Home Financials are based on the most recent Mortgage that was taken out on this home.
Original Mortgage
$106,050
Interest Rate
7.59%
Mortgage Type
Assumption
Create a Home Valuation Report for This Property
The Home Valuation Report is an in-depth analysis detailing your home's value as well as a comparison with similar homes in the area
Home Values in the Area
Average Home Value in this Area
Purchase History
| Date | Buyer | Sale Price | Title Company |
|---|---|---|---|
| Salaiz Rudy G | -- | None Available | |
| Salaiz Rudy G | -- | None Available | |
| Osmond Kenneth W | -- | Title Agency |
Source: Public Records
Mortgage History
| Date | Status | Borrower | Loan Amount |
|---|---|---|---|
| Open | Salaiz Rudy G | $164,795 | |
| Closed | Salaiz Rudy G | $164,795 | |
| Previous Owner | Osmond Kenneth W | $106,050 |
Source: Public Records
Tax History Compared to Growth
Tax History
| Year | Tax Paid | Tax Assessment Tax Assessment Total Assessment is a certain percentage of the fair market value that is determined by local assessors to be the total taxable value of land and additions on the property. | Land | Improvement |
|---|---|---|---|---|
| 2025 | $5,558 | $232,950 | -- | -- |
| 2024 | $5,558 | $211,773 | -- | -- |
| 2023 | $5,031 | $192,521 | $0 | $0 |
| 2022 | $5,547 | $175,019 | $0 | $0 |
| 2021 | $5,596 | $182,074 | $16,030 | $166,044 |
| 2020 | $5,117 | $144,644 | $16,030 | $128,614 |
| 2018 | $4,522 | $140,243 | $16,030 | $124,213 |
| 2017 | $4,260 | $133,603 | $16,030 | $117,573 |
| 2016 | $4,260 | $133,603 | $16,030 | $117,573 |
| 2015 | $3,975 | $133,603 | $16,030 | $117,573 |
| 2014 | $3,975 | $135,166 | $16,030 | $119,136 |
Source: Public Records
Map
Nearby Homes
- TBD Tbd
- 369 Cross River Rd
- 16020 Homestead Dr
- PN-129994 Darrington
- 14841 Kingston Rd
- 14937 Roslyn Dr
- 14829 Kingston Rd
- 307 Golf View Ln
- 390 Medill Place
- 3705 Roslyn Dr
- PN-31080 Tbd
- 400 Mura Place
- 13957 Paseo Honor Ct
- 394 Brill Cir
- 0 Fallon Rd Unit 928403
- 0 Highweed Dr Unit 918787
- 13860 Summer View Ave
- 13829 Summer View Ave
- 13915 Sky Harbor Ave
- 485 Jeweled Mesa Ct
- 308 Pete La Rue Cir
- 13916 Pete La Rue Cir
- 405 Mercer Ln
- 315 Roslyn Dr
- 313 Roslyn Dr
- 407 Mercer Ln
- 312 Pete La Rue Cir
- 311 Roslyn Dr
- 13912 Pete La Rue Cir
- 403 Mercer Ln
- 411 Mercer Ln
- 13915 Pete La Rue Cir
- 309 Roslyn Dr
- 316 Pete La Rue Cir
- 13908 Pete La Rue Cir
- 13913 Pete La Rue Cir
- 413 Mercer Ln
- 324 Higley Cir
- 307 Roslyn Dr
- 401 Mercer Ln