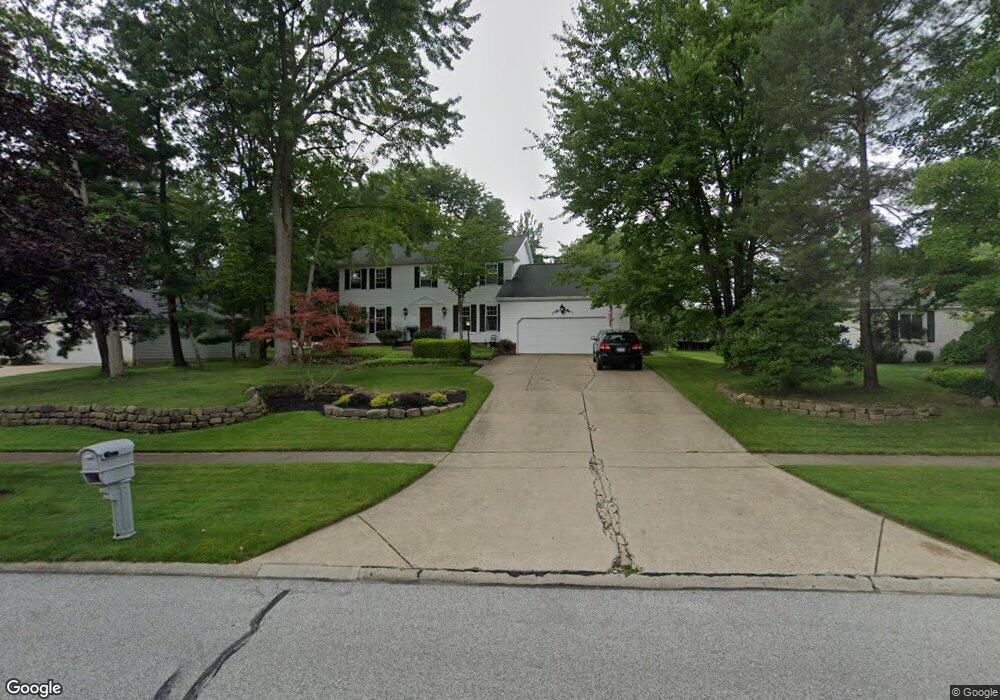
13920 Prince Charles Dr North Royalton, OH 44133
Estimated Value: $408,000 - $470,000
4
Beds
3
Baths
2,515
Sq Ft
$173/Sq Ft
Est. Value
About This Home
This home is located at 13920 Prince Charles Dr, North Royalton, OH 44133 and is currently estimated at $436,352, approximately $173 per square foot. 13920 Prince Charles Dr is a home located in Cuyahoga County with nearby schools including North Royalton Middle School, North Royalton High School, and Assumption Academy.
Ownership History
Date
Name
Owned For
Owner Type
Purchase Details
Closed on
May 26, 2006
Sold by
Koch Thomas J and Koch Kathleen B
Bought by
Ellis Matthew F and Ellis Julie M
Current Estimated Value
Home Financials for this Owner
Home Financials are based on the most recent Mortgage that was taken out on this home.
Original Mortgage
$192,000
Outstanding Balance
$113,196
Interest Rate
6.62%
Mortgage Type
Purchase Money Mortgage
Estimated Equity
$323,156
Purchase Details
Closed on
Mar 8, 1985
Sold by
Koch Thomas J
Bought by
Koch Thomas J
Purchase Details
Closed on
Dec 13, 1979
Bought by
Koch Thomas J
Purchase Details
Closed on
Jul 23, 1979
Sold by
Difini John D
Bought by
Sunlight Constr Inc
Purchase Details
Closed on
Jan 13, 1978
Sold by
Zimmer Willard J
Bought by
Difini John D
Purchase Details
Closed on
May 3, 1977
Sold by
Zimmer Willard J and Zimmer Rose
Bought by
Zimmer Willard J
Purchase Details
Closed on
Jan 1, 1975
Bought by
Zimmer Willard J and Zimmer Rose
Create a Home Valuation Report for This Property
The Home Valuation Report is an in-depth analysis detailing your home's value as well as a comparison with similar homes in the area
Home Values in the Area
Average Home Value in this Area
Purchase History
| Date | Buyer | Sale Price | Title Company |
|---|---|---|---|
| Ellis Matthew F | $272,000 | Revere | |
| Koch Thomas J | -- | -- | |
| Koch Thomas J | $108,700 | -- | |
| Sunlight Constr Inc | $26,500 | -- | |
| Difini John D | $52,000 | -- | |
| Zimmer Willard J | -- | -- | |
| Zimmer Willard J | -- | -- |
Source: Public Records
Mortgage History
| Date | Status | Borrower | Loan Amount |
|---|---|---|---|
| Open | Ellis Matthew F | $192,000 |
Source: Public Records
Tax History Compared to Growth
Tax History
| Year | Tax Paid | Tax Assessment Tax Assessment Total Assessment is a certain percentage of the fair market value that is determined by local assessors to be the total taxable value of land and additions on the property. | Land | Improvement |
|---|---|---|---|---|
| 2024 | $8,138 | $140,105 | $22,610 | $117,495 |
| 2023 | $5,992 | $94,610 | $23,520 | $71,090 |
| 2022 | $5,951 | $94,610 | $23,520 | $71,090 |
| 2021 | $6,014 | $94,610 | $23,520 | $71,090 |
| 2020 | $5,969 | $89,250 | $22,190 | $67,060 |
| 2019 | $5,795 | $255,000 | $63,400 | $191,600 |
| 2018 | $5,542 | $89,250 | $22,190 | $67,060 |
| 2017 | $5,580 | $81,210 | $20,130 | $61,080 |
| 2016 | $5,229 | $81,210 | $20,130 | $61,080 |
| 2015 | $5,269 | $81,210 | $20,130 | $61,080 |
| 2014 | $5,269 | $81,210 | $20,130 | $61,080 |
Source: Public Records
Map
Nearby Homes
- 5213 Royalton Rd
- 5299 Whistler Ct
- 4428 Akins Rd
- 2801 W Royalton Rd
- 11431 Villa Grande Dr
- 3696 Jupiter Dr
- 0 Valley Pkwy Unit 5118483
- 11900 Rolling Meadow Ln
- 2301 W Royalton Rd
- 11960 Apollo Dr
- 9478 Scottsdale Dr
- 16577 State Rd
- 7400 Akins Rd
- 3204 Thorn Tree Dr
- 9210 Ledge View Terrace
- LUCAS TH Plan at The Ledges
- LIBBY TH Plan at The Ledges
- ABBY TH Plan at The Ledges
- 9055 Ledge View Terrace
- 2022 Akins Rd
- 13940 Prince Charles Dr
- 13880 Prince Charles Dr
- 13860 Prince Charles Dr
- 13921 Prince Charles Dr
- 4491 Sir Richard Ave
- 4700 Royalton Rd
- 13941 Prince Charles Dr
- 4746 Royalton Rd
- 4630 Royalton Rd
- 13840 Prince Charles Dr
- 13961 Prince Charles Dr
- 4471 Sir Richard Ave
- 4924 Royalton Rd
- 4872 Royalton Rd
- 13981 Prince Charles Dr
- 13820 Prince Charles Dr
- 4451 Sir Richard Ave
- 4490 Sir Richard Ave
- 4470 Sir Richard Ave
- 4948 Royalton Rd