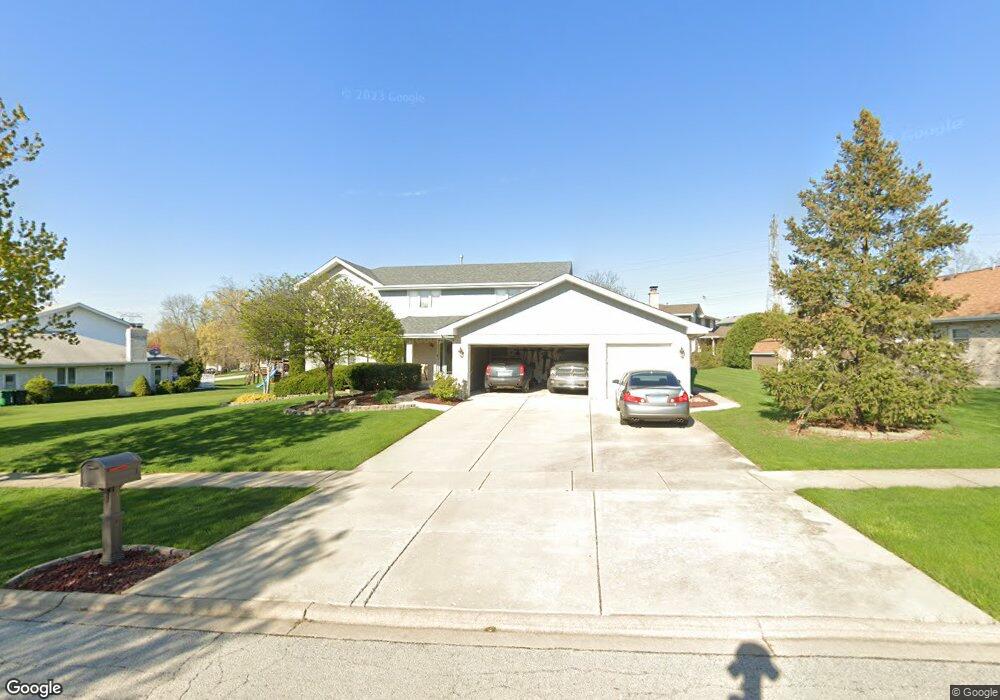
13925 S Split Rail Dr Unit 6 Homer Glen, IL 60491
Estimated Value: $501,000 - $564,131
4
Beds
3
Baths
3,167
Sq Ft
$171/Sq Ft
Est. Value
About This Home
This home is located at 13925 S Split Rail Dr Unit 6, Homer Glen, IL 60491 and is currently estimated at $543,033, approximately $171 per square foot. 13925 S Split Rail Dr Unit 6 is a home located in Will County with nearby schools including Goodings Grove School, Hadley Middle School, and Homer Jr High School.
Ownership History
Date
Name
Owned For
Owner Type
Purchase Details
Closed on
Oct 28, 2011
Sold by
Averill Kevin and Averill Julianna C
Bought by
Averill Kevin and Averill Julianna C
Current Estimated Value
Purchase Details
Closed on
Jul 11, 2011
Sold by
Seaborg Roger L
Bought by
Averill Kevin and Averill Julianna C
Purchase Details
Closed on
Feb 16, 2011
Sold by
Kaupas Paul J and Fifth Third Mortgage Co
Bought by
Seaborg Roger L
Purchase Details
Closed on
Jan 19, 2011
Sold by
Bowlen Sean and Fifth Third Mortgage Company
Bought by
Seaborg Roger
Purchase Details
Closed on
Nov 20, 1998
Sold by
Bowlen Sean M
Bought by
Bowlen Sean M and Trust #98-13925
Purchase Details
Closed on
Jan 13, 1997
Sold by
Standard Bank & Trust Company
Bought by
Bowlen Sean M
Create a Home Valuation Report for This Property
The Home Valuation Report is an in-depth analysis detailing your home's value as well as a comparison with similar homes in the area
Home Values in the Area
Average Home Value in this Area
Purchase History
| Date | Buyer | Sale Price | Title Company |
|---|---|---|---|
| Averill Kevin | -- | None Available | |
| Averill Kevin | $289,000 | Fidelity National Title | |
| Seaborg Roger L | -- | None Available | |
| Seaborg Roger | $186,000 | None Available | |
| Bowlen Sean M | -- | -- | |
| Bowlen Sean M | $280,000 | Chicago Title Insurance Co |
Source: Public Records
Tax History Compared to Growth
Tax History
| Year | Tax Paid | Tax Assessment Tax Assessment Total Assessment is a certain percentage of the fair market value that is determined by local assessors to be the total taxable value of land and additions on the property. | Land | Improvement |
|---|---|---|---|---|
| 2024 | $12,270 | $177,010 | $30,761 | $146,249 |
| 2023 | $12,270 | $160,451 | $27,883 | $132,568 |
| 2022 | $11,205 | $149,815 | $26,035 | $123,780 |
| 2021 | $10,674 | $141,937 | $24,666 | $117,271 |
| 2020 | $10,712 | $136,714 | $23,758 | $112,956 |
| 2019 | $10,210 | $131,519 | $22,855 | $108,664 |
| 2018 | $10,297 | $131,096 | $22,593 | $108,503 |
| 2017 | $10,111 | $127,427 | $21,961 | $105,466 |
| 2016 | $9,868 | $123,178 | $21,229 | $101,949 |
| 2015 | $9,449 | $118,554 | $20,432 | $98,122 |
| 2014 | $9,449 | $116,104 | $20,010 | $96,094 |
| 2013 | $9,449 | $116,104 | $20,010 | $96,094 |
Source: Public Records
Map
Nearby Homes
- 13017 W Hiawatha Dr
- 13929 S Teakwood Dr
- 13755 S Golden Oak Dr
- 13952 S Oak Ridge Dr
- 13124 W Beaver Lake Dr
- 13132 W Beaver Lake Dr
- 13408 W Catawba Ln
- 13547 Lost Boy Ln
- 13926 S Addison Trail
- 14017 S Belmont Dr
- 14019 S Belmont Dr
- 13300 W Onondaga Trail
- 13521 W Catawba Ln
- 14325 S Bell Rd
- Fremont Plan at Goodings Grove
- Eden Plan at Goodings Grove
- Danbury Plan at Goodings Grove
- Calysta Plan at Goodings Grove
- Briarcliffe Plan at Goodings Grove
- Amberwood Plan at Goodings Grove
- 13937 S Split Rail Dr
- 13911 S Split Rail Dr
- 13027 W Hiawatha Dr
- 13020 W Split Rail Ct
- 13932 S Split Rail Dr
- 13920 S Split Rail Dr
- 13940 S Split Rail Dr
- 13912 S Split Rail Dr
- 13018 W Split Rail Ct
- 13946 S Split Rail Dr
- 13027 W Split Rail Ct
- 13007 W Hiawatha Dr
- 13857 S Split Rail Dr
- 13021 W Creekside Dr
- 13015 W Split Rail Ct
- 13017 W Split Rail Ct
- 13921 S Trails End Dr
- 13933 S Trails End Dr
- 13945 S Trails End Dr