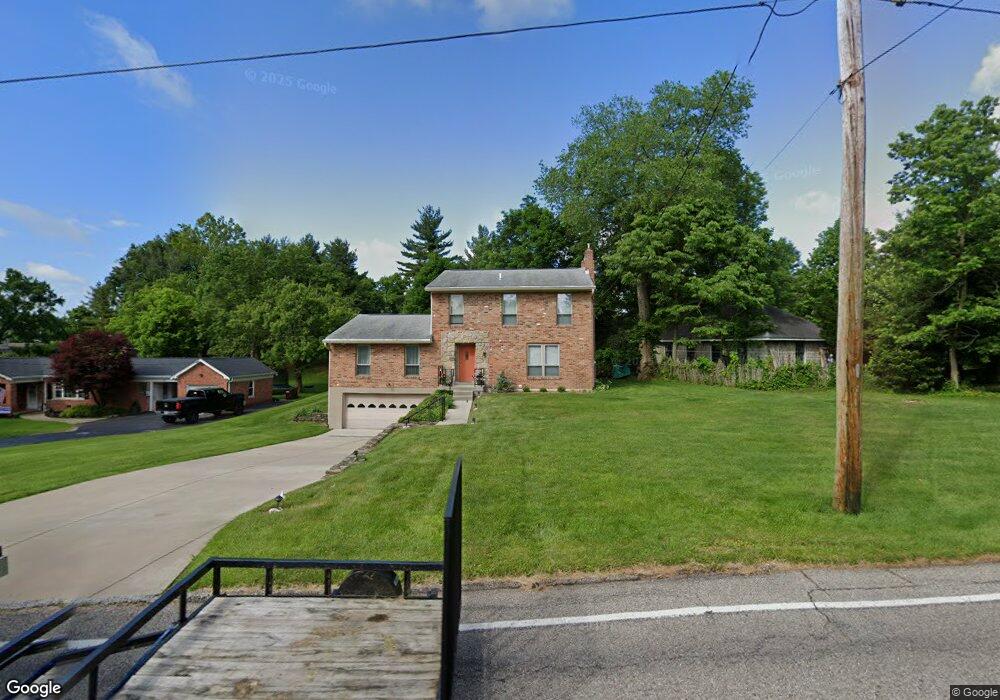
1393 Devils Backbone Rd Cincinnati, OH 45233
Estimated Value: $351,682 - $406,000
4
Beds
4
Baths
2,244
Sq Ft
$169/Sq Ft
Est. Value
About This Home
This home is located at 1393 Devils Backbone Rd, Cincinnati, OH 45233 and is currently estimated at $378,171, approximately $168 per square foot. 1393 Devils Backbone Rd is a home located in Hamilton County with nearby schools including John Foster Dulles Elementary School, Rapid Run Middle School, and Oak Hills High School.
Create a Home Valuation Report for This Property
The Home Valuation Report is an in-depth analysis detailing your home's value as well as a comparison with similar homes in the area
Home Values in the Area
Average Home Value in this Area
Tax History
| Year | Tax Paid | Tax Assessment Tax Assessment Total Assessment is a certain percentage of the fair market value that is determined by local assessors to be the total taxable value of land and additions on the property. | Land | Improvement |
|---|---|---|---|---|
| 2025 | $4,436 | $95,368 | $16,149 | $79,219 |
| 2023 | $4,376 | $95,368 | $16,149 | $79,219 |
| 2022 | $3,802 | $72,219 | $14,469 | $57,750 |
| 2021 | $3,404 | $72,219 | $14,469 | $57,750 |
| 2020 | $3,460 | $72,219 | $14,469 | $57,750 |
| 2019 | $3,327 | $64,481 | $12,919 | $51,562 |
| 2018 | $3,333 | $64,481 | $12,919 | $51,562 |
| 2017 | $3,135 | $64,481 | $12,919 | $51,562 |
| 2016 | $2,760 | $57,838 | $13,272 | $44,566 |
| 2015 | $2,791 | $57,838 | $13,272 | $44,566 |
| 2014 | $2,796 | $57,838 | $13,272 | $44,566 |
| 2013 | $2,643 | $58,422 | $13,405 | $45,017 |
Source: Public Records
Map
Nearby Homes
- 5949 Cleves Warsaw Pike
- 6009 Cleves Warsaw Pike
- 1659 Devils Backbone Rd
- 1711 Ebenezer Rd
- 1287 Heather Ridge
- 5671 Julmar Dr
- 1259 Wexford Ln
- 5749 Beech Grove Ln
- 2202 Ebenezer Rd
- 6278 Gardenlake Ct
- 1006 Pineknot Dr
- 837 Neeb Rd
- 6090 Muddy Creek Rd
- 5690 Candlelite Terrace
- 6040 Countrymeadow Ln
- 5600 Antoninus Dr
- 5789 Juvene Way
- 2026 Bellglade Terrace
- 5773 Fourson Dr
- 5528 Cove Ct
- 1415 Devils Backbone Rd
- 1391 Devils Backbone Rd
- 1390 Devils Backbone Rd
- 1435 Devils Backbone Rd
- 1435 Devils Backbone Rd Unit 2
- 1371 Devils Backbone Rd
- 1423 Devils Backbone Rd
- 1400 Devils Backbone Rd
- 1412 Devils Backbone Rd
- 1378 Devils Backbone Rd
- 5974 Cleves Warsaw Pike
- 1426 Devils Backbone Rd
- 1357 Devils Backbone Rd
- 1447 Devils Backbone Rd
- 1354 Devils Backbone Rd
- 1438 Devils Backbone Rd
- 1461 Devils Backbone Rd
- 5972 Cleves Warsaw Pike
- 1331 Devils Backbone Rd
- 5965 Beechollow Ct
Your Personal Tour Guide
Ask me questions while you tour the home.