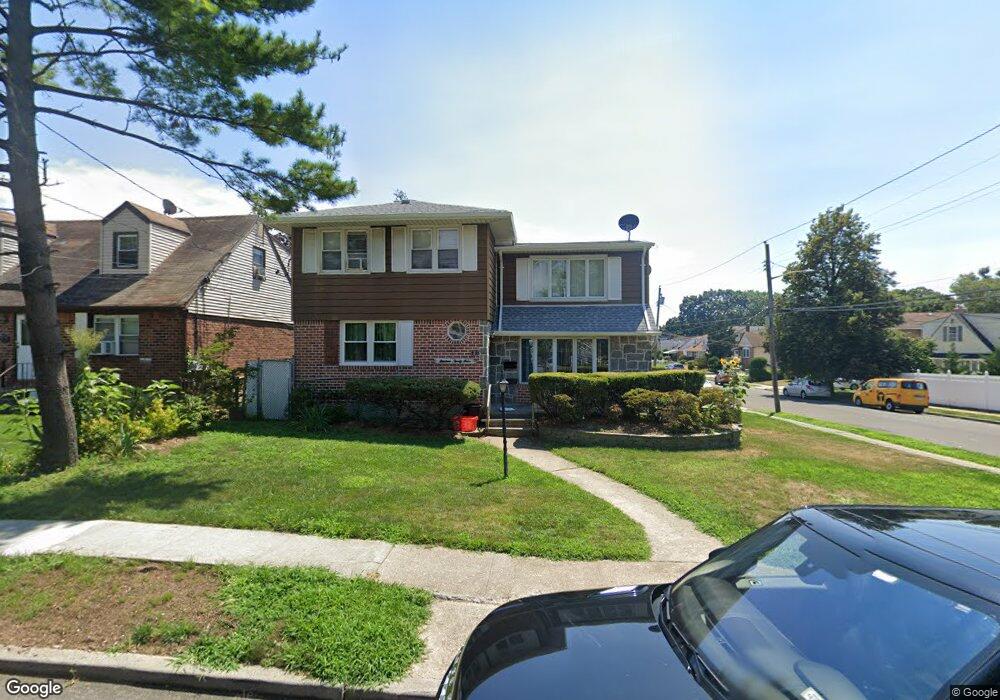
1393 E St Elmont, NY 11003
Estimated Value: $844,122 - $991,000
2
Beds
1
Bath
2,102
Sq Ft
$438/Sq Ft
Est. Value
About This Home
This home is located at 1393 E St, Elmont, NY 11003 and is currently estimated at $921,281, approximately $438 per square foot. 1393 E St is a home located in Nassau County with nearby schools including Cheder at the Ohel.
Ownership History
Date
Name
Owned For
Owner Type
Purchase Details
Closed on
Nov 13, 1995
Sold by
Nugent Ewart and Nugent Patrick
Bought by
Nugent Ewart
Current Estimated Value
Home Financials for this Owner
Home Financials are based on the most recent Mortgage that was taken out on this home.
Original Mortgage
$164,700
Interest Rate
7.71%
Purchase Details
Closed on
Oct 11, 1995
Sold by
Pook Alfred and Pook Margit
Bought by
Nugent Ewart and Nugent Patrick
Home Financials for this Owner
Home Financials are based on the most recent Mortgage that was taken out on this home.
Original Mortgage
$164,700
Interest Rate
7.71%
Create a Home Valuation Report for This Property
The Home Valuation Report is an in-depth analysis detailing your home's value as well as a comparison with similar homes in the area
Home Values in the Area
Average Home Value in this Area
Purchase History
| Date | Buyer | Sale Price | Title Company |
|---|---|---|---|
| Nugent Ewart | -- | -- | |
| Nugent Ewart | $183,000 | -- |
Source: Public Records
Mortgage History
| Date | Status | Borrower | Loan Amount |
|---|---|---|---|
| Previous Owner | Nugent Ewart | $164,700 |
Source: Public Records
Tax History
| Year | Tax Paid | Tax Assessment Tax Assessment Total Assessment is a certain percentage of the fair market value that is determined by local assessors to be the total taxable value of land and additions on the property. | Land | Improvement |
|---|---|---|---|---|
| 2025 | $14,569 | $549 | $267 | $282 |
| 2024 | $4,549 | $549 | $267 | $282 |
Source: Public Records
Map
Nearby Homes
Your Personal Tour Guide
Ask me questions while you tour the home.