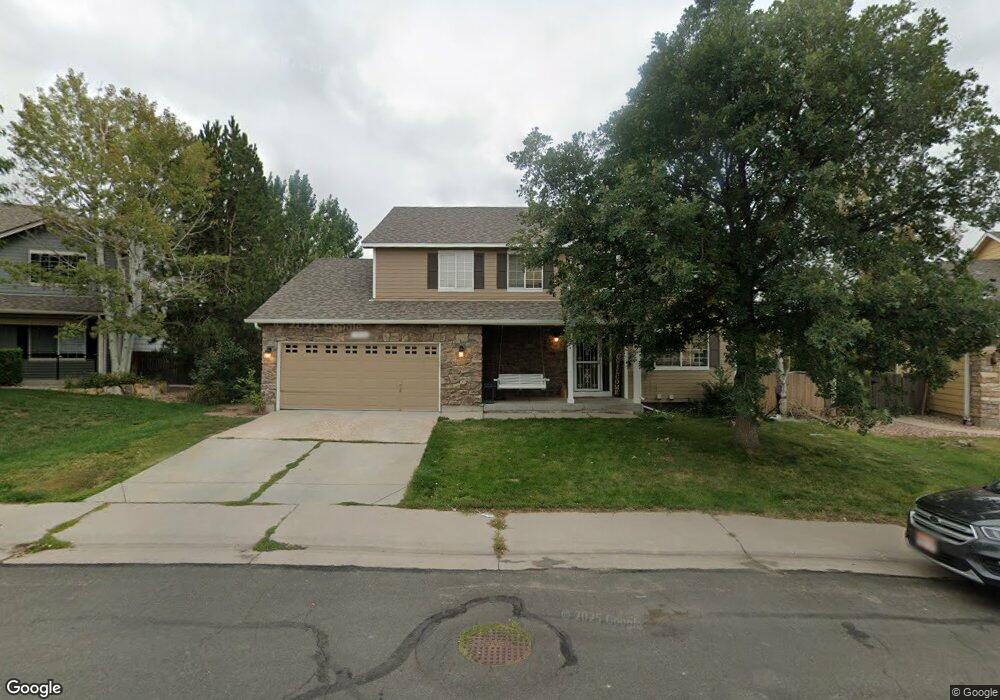
13930 Grape St Thornton, CO 80602
Estimated Value: $576,832 - $624,000
4
Beds
3
Baths
2,324
Sq Ft
$260/Sq Ft
Est. Value
About This Home
This home is located at 13930 Grape St, Thornton, CO 80602 and is currently estimated at $603,708, approximately $259 per square foot. 13930 Grape St is a home located in Adams County with nearby schools including Silver Creek Elementary School, Rocky Top Middle School, and Horizon High School.
Ownership History
Date
Name
Owned For
Owner Type
Purchase Details
Closed on
Aug 6, 2015
Sold by
Billings Charles A
Bought by
Billings Charles A and Billings Amy R
Current Estimated Value
Purchase Details
Closed on
Apr 10, 2013
Sold by
Billings Charles A and Billings Ruth A
Bought by
Billings Charles A
Home Financials for this Owner
Home Financials are based on the most recent Mortgage that was taken out on this home.
Original Mortgage
$211,200
Outstanding Balance
$147,970
Interest Rate
3.61%
Mortgage Type
New Conventional
Estimated Equity
$455,738
Purchase Details
Closed on
Dec 28, 2001
Sold by
Melody Homes Inc
Bought by
Billings Charles A and Billings Ruth A
Home Financials for this Owner
Home Financials are based on the most recent Mortgage that was taken out on this home.
Original Mortgage
$194,350
Interest Rate
6.73%
Create a Home Valuation Report for This Property
The Home Valuation Report is an in-depth analysis detailing your home's value as well as a comparison with similar homes in the area
Purchase History
| Date | Buyer | Sale Price | Title Company |
|---|---|---|---|
| Billings Charles A | -- | None Available | |
| Billings Charles A | -- | First American | |
| Billings Charles A | $242,964 | Land Title |
Source: Public Records
Mortgage History
| Date | Status | Borrower | Loan Amount |
|---|---|---|---|
| Open | Billings Charles A | $211,200 | |
| Closed | Billings Charles A | $194,350 |
Source: Public Records
Tax History
| Year | Tax Paid | Tax Assessment Tax Assessment Total Assessment is a certain percentage of the fair market value that is determined by local assessors to be the total taxable value of land and additions on the property. | Land | Improvement |
|---|---|---|---|---|
| 2025 | $3,831 | $38,830 | $8,500 | $30,330 |
| 2024 | $3,831 | $35,690 | $7,810 | $27,880 |
| 2023 | $3,792 | $40,720 | $7,440 | $33,280 |
| 2022 | $3,384 | $30,330 | $7,650 | $22,680 |
| 2021 | $3,496 | $30,330 | $7,650 | $22,680 |
| 2020 | $3,302 | $29,230 | $7,870 | $21,360 |
| 2019 | $3,308 | $29,230 | $7,870 | $21,360 |
| 2018 | $3,176 | $27,270 | $7,560 | $19,710 |
| 2017 | $2,891 | $27,270 | $7,560 | $19,710 |
| 2016 | $2,379 | $21,850 | $4,940 | $16,910 |
| 2015 | $2,375 | $21,850 | $4,940 | $16,910 |
| 2014 | -- | $18,900 | $4,140 | $14,760 |
Source: Public Records
Map
Nearby Homes
- 13980 Glencoe St
- 13966 Forest St
- 5382 E 140th Place
- 5323 E 140th Place
- 13808 Hudson Way
- 14067 Hudson St
- 13905 Ivy St
- 13871 Ivy St
- 15276 Pontiac St
- 15286 Pontiac St
- 13686 Dexter St
- 13850 Dexter St
- 14246 Glencoe St
- 14240 Ivanhoe St
- 5261 E 143rd Dr
- 4590 E 136th Place
- 13814 Lilac St
- 13664 Linden Ct
- 14437 Grape St
- 6285 E 135th Ave
- 13940 Grape St
- 13920 Grape St
- 13865 Hudson St
- 13885 Hudson St
- 13925 Hudson St
- 13950 Grape St
- 13935 Hudson St
- 13845 Hudson St
- 13935 Grape St
- 13910 Grape St
- 13945 Hudson St
- 13945 Grape St
- 13825 Hudson St
- 13900 Glencoe St
- 13890 Glencoe St
- 13955 Hudson St
- 13930 Glencoe St
- 13860 Hudson St
- 13840 Hudson St
- 13860 Glencoe St
Your Personal Tour Guide
Ask me questions while you tour the home.