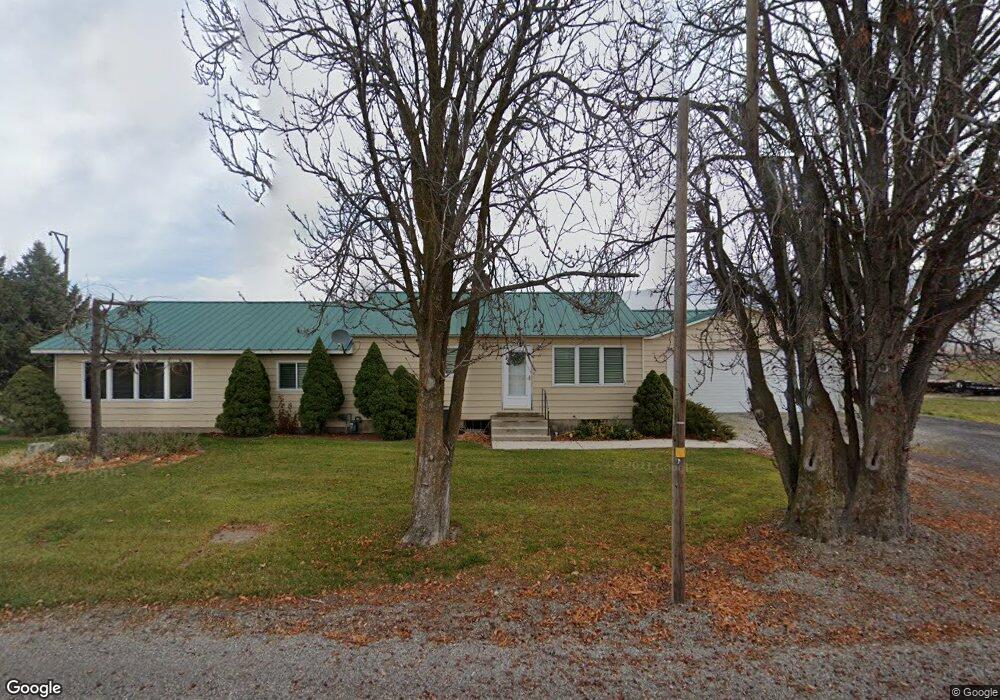
13930 N 4400 W Garland, UT 84312
Estimated Value: $363,000 - $824,514
--
Bed
--
Bath
1,304
Sq Ft
$438/Sq Ft
Est. Value
About This Home
This home is located at 13930 N 4400 W, Garland, UT 84312 and is currently estimated at $571,629, approximately $438 per square foot. 13930 N 4400 W is a home located in Box Elder County with nearby schools including Fielding School, Bear River Middle School, and Alice C. Harris Intermediate School.
Ownership History
Date
Name
Owned For
Owner Type
Purchase Details
Closed on
Jun 9, 2014
Sold by
Shaffer Sandra
Bought by
Shaffer Ric W and Shaffer Shamra
Current Estimated Value
Create a Home Valuation Report for This Property
The Home Valuation Report is an in-depth analysis detailing your home's value as well as a comparison with similar homes in the area
Home Values in the Area
Average Home Value in this Area
Purchase History
| Date | Buyer | Sale Price | Title Company |
|---|---|---|---|
| Shaffer Ric W | -- | Accommodation |
Source: Public Records
Tax History Compared to Growth
Tax History
| Year | Tax Paid | Tax Assessment Tax Assessment Total Assessment is a certain percentage of the fair market value that is determined by local assessors to be the total taxable value of land and additions on the property. | Land | Improvement |
|---|---|---|---|---|
| 2025 | $1,427 | $300,316 | $144,985 | $155,331 |
| 2024 | $1,427 | $293,184 | $144,288 | $148,896 |
| 2023 | $1,451 | $303,906 | $143,455 | $160,451 |
| 2022 | $1,329 | $260,748 | $78,725 | $182,023 |
| 2021 | $1,291 | $137,557 | $43,478 | $94,079 |
| 2020 | $860 | $137,557 | $43,478 | $94,079 |
| 2019 | $814 | $52,374 | $13,388 | $38,986 |
| 2018 | $833 | $74,405 | $31,485 | $42,920 |
| 2017 | $872 | $280,657 | $32,295 | $70,657 |
| 2016 | $845 | $73,399 | $32,093 | $41,306 |
| 2015 | $801 | $69,824 | $32,273 | $37,551 |
| 2014 | $801 | $68,853 | $32,700 | $36,153 |
| 2013 | -- | $67,347 | $33,735 | $33,612 |
Source: Public Records
Map
Nearby Homes
- 4770 W 13600 N
- 13189 N Brookside Dr
- 3536 W 14100 N
- 13700 N 3100 W
- 14360 N 6000 W
- 13200 N 6000 W
- 16449 N 6000 W
- 627 N Main St
- 15920 N 4000 W Unit 14
- 11990 N 4800 W
- 112 S Main St
- 16151 N 6125 W Unit 7
- 4979 W 12000 N
- 1183 S 1335 E Unit 76
- 1113 E 1230 S
- 35 W 300 S
- 1118 E 1310 S
- 645 S 200 W
- 477 E 1325 S
- 318 N 900 W
- 13930 N 4400 W
- 13885 N 4400 W
- 13885 N 4400 W
- 13905 N 4400 W
- 13965 N 4400 W
- 4444 W 13900 N
- 13865 N 4400 W
- 13995 N 4400 W
- 13820 N 4400 W
- 13810 N 4400 W
- 13790 N East Garland Rd
- 13785 N East Garland Rd
- 14140 N 4400 W
- 14160 N 4400 W
- 14165 N 4400 W
- 13695 N East Garland Rd
- 13690 N East Garland Rd
- 14210 N 4400 W
- 13636 N 4400 W
- 13636 N East Garland Rd