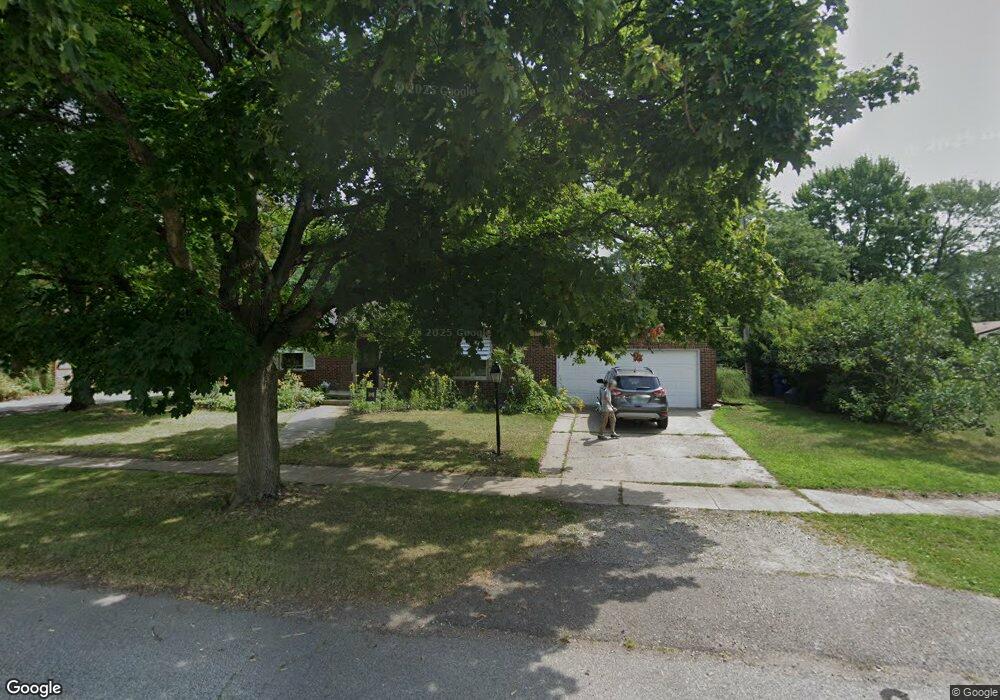
13932 Arnold Redford, MI 48239
Estimated Value: $179,000 - $221,000
--
Bed
1
Bath
1,027
Sq Ft
$193/Sq Ft
Est. Value
About This Home
This home is located at 13932 Arnold, Redford, MI 48239 and is currently estimated at $198,711, approximately $193 per square foot. 13932 Arnold is a home located in Wayne County with nearby schools including John D. Pierce Middle School, Lee M. Thurston High School, and Detroit Leadership Academy.
Ownership History
Date
Name
Owned For
Owner Type
Purchase Details
Closed on
May 26, 2020
Sold by
Fedon Deborah A
Bought by
Fedon Deborah A and Fedon Deborah A
Current Estimated Value
Purchase Details
Closed on
Jun 13, 2019
Sold by
Keyt Ellen
Bought by
Fedon Deborah A
Home Financials for this Owner
Home Financials are based on the most recent Mortgage that was taken out on this home.
Original Mortgage
$118,795
Outstanding Balance
$104,238
Interest Rate
4%
Mortgage Type
VA
Estimated Equity
$94,473
Purchase Details
Closed on
Jun 28, 2005
Sold by
Estate Of Neible T Rossi
Bought by
Aston James
Purchase Details
Closed on
Feb 15, 2005
Sold by
Aston James D and Rossi Neible T
Bought by
Keyt Ellen
Home Financials for this Owner
Home Financials are based on the most recent Mortgage that was taken out on this home.
Original Mortgage
$103,900
Interest Rate
5.64%
Mortgage Type
Fannie Mae Freddie Mac
Purchase Details
Closed on
Jun 18, 2003
Sold by
Rossi Neible T
Bought by
Rossi Neible T
Create a Home Valuation Report for This Property
The Home Valuation Report is an in-depth analysis detailing your home's value as well as a comparison with similar homes in the area
Home Values in the Area
Average Home Value in this Area
Purchase History
| Date | Buyer | Sale Price | Title Company |
|---|---|---|---|
| Fedon Deborah A | -- | None Available | |
| Fedon Deborah A | -- | Ticor Title Company | |
| Aston James | -- | -- | |
| Keyt Ellen | $129,900 | Family Title Agency | |
| Rossi Neible T | -- | Commonwealth Land Title |
Source: Public Records
Mortgage History
| Date | Status | Borrower | Loan Amount |
|---|---|---|---|
| Open | Fedon Deborah A | $118,795 | |
| Previous Owner | Keyt Ellen | $103,900 |
Source: Public Records
Tax History Compared to Growth
Tax History
| Year | Tax Paid | Tax Assessment Tax Assessment Total Assessment is a certain percentage of the fair market value that is determined by local assessors to be the total taxable value of land and additions on the property. | Land | Improvement |
|---|---|---|---|---|
| 2025 | $1,024 | $99,500 | $0 | $0 |
| 2024 | $1,024 | $93,100 | $0 | $0 |
| 2023 | $981 | $84,000 | $0 | $0 |
| 2022 | $2,820 | $75,200 | $0 | $0 |
| 2021 | $2,740 | $69,900 | $0 | $0 |
| 2020 | $2,702 | $61,200 | $0 | $0 |
| 2019 | $2,643 | $57,500 | $0 | $0 |
| 2018 | $883 | $50,400 | $0 | $0 |
| 2017 | $3,055 | $48,000 | $0 | $0 |
| 2016 | $2,381 | $45,000 | $0 | $0 |
| 2015 | $3,708 | $41,100 | $0 | $0 |
| 2013 | $4,010 | $41,300 | $0 | $0 |
| 2012 | $2,448 | $44,300 | $8,300 | $36,000 |
Source: Public Records
Map
Nearby Homes