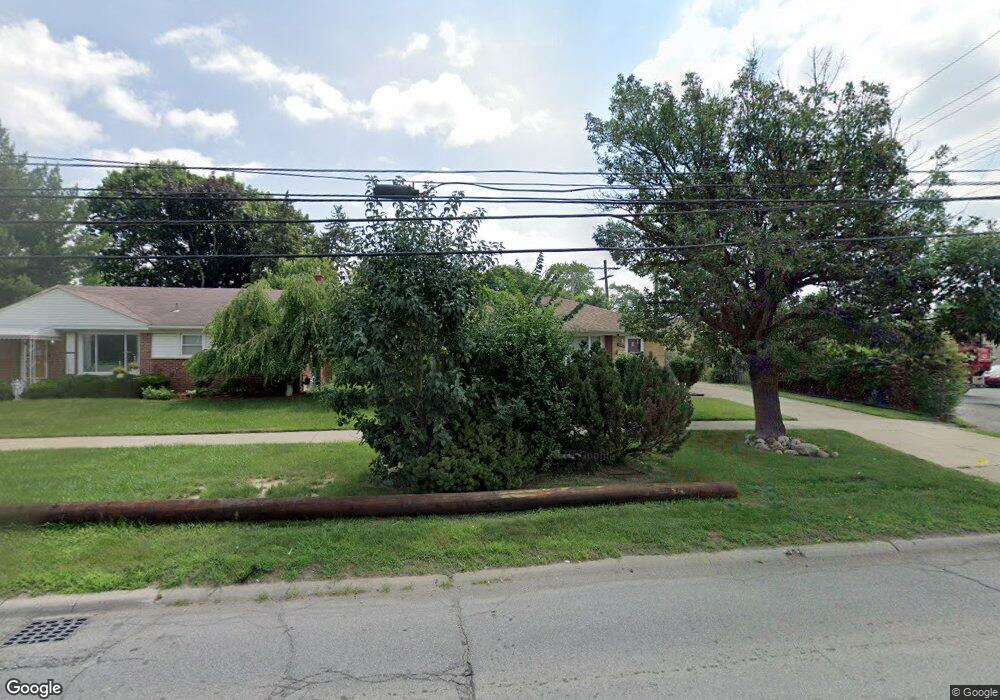
13932 Beech Daly Rd Redford, MI 48239
Estimated Value: $193,418 - $247,000
3
Beds
2
Baths
1,100
Sq Ft
$202/Sq Ft
Est. Value
About This Home
This home is located at 13932 Beech Daly Rd, Redford, MI 48239 and is currently estimated at $222,605, approximately $202 per square foot. 13932 Beech Daly Rd is a home located in Wayne County with nearby schools including John D. Pierce Middle School, Lee M. Thurston High School, and Detroit Leadership Academy.
Ownership History
Date
Name
Owned For
Owner Type
Purchase Details
Closed on
Jun 6, 2016
Sold by
Matalka Suleiman H and Azouz Asmaa Gh
Bought by
S H M Properties Llc
Current Estimated Value
Purchase Details
Closed on
Oct 28, 2015
Sold by
S H M Properties Llc
Bought by
Matalka Suleiman H
Purchase Details
Closed on
May 13, 2013
Sold by
Matalka Suleiman
Bought by
Shm Properties Llc
Purchase Details
Closed on
Jan 18, 2011
Sold by
Citimortgage Inc
Bought by
Matalka Suleiman
Purchase Details
Closed on
Oct 25, 2010
Sold by
Hockenhull Terri P
Bought by
Citimortgage Inc
Purchase Details
Closed on
Sep 23, 2010
Sold by
Hockenhull Terri P
Bought by
Citimortgage Inc
Purchase Details
Closed on
Jun 17, 2005
Sold by
Cetnar John A and Cetnar Christina
Bought by
Hockenhull Terri P
Purchase Details
Closed on
May 20, 1998
Sold by
Tomc Tomczak J and Tomc Michael
Bought by
Cetnar A
Create a Home Valuation Report for This Property
The Home Valuation Report is an in-depth analysis detailing your home's value as well as a comparison with similar homes in the area
Home Values in the Area
Average Home Value in this Area
Purchase History
| Date | Buyer | Sale Price | Title Company |
|---|---|---|---|
| S H M Properties Llc | -- | Attorney | |
| Matalka Suleiman H | -- | None Available | |
| Shm Properties Llc | -- | None Available | |
| Matalka Suleiman | $27,000 | E Title Agency Inc | |
| Citimortgage Inc | -- | E Title | |
| Citimortgage Inc | $21,763 | None Available | |
| Hockenhull Terri P | $143,500 | Clearly Title | |
| Cetnar A | $92,000 | -- |
Source: Public Records
Tax History Compared to Growth
Tax History
| Year | Tax Paid | Tax Assessment Tax Assessment Total Assessment is a certain percentage of the fair market value that is determined by local assessors to be the total taxable value of land and additions on the property. | Land | Improvement |
|---|---|---|---|---|
| 2025 | $1,210 | $91,100 | $0 | $0 |
| 2024 | $1,210 | $85,000 | $0 | $0 |
| 2023 | $1,157 | $76,400 | $0 | $0 |
| 2022 | $3,032 | $67,300 | $0 | $0 |
| 2021 | $2,944 | $62,300 | $0 | $0 |
| 2020 | $2,904 | $54,300 | $0 | $0 |
| 2019 | $2,843 | $50,600 | $0 | $0 |
| 2018 | $1,032 | $42,500 | $0 | $0 |
| 2017 | $3,131 | $39,300 | $0 | $0 |
| 2016 | $2,561 | $37,700 | $0 | $0 |
| 2015 | $3,107 | $34,000 | $0 | $0 |
| 2013 | $3,070 | $30,700 | $0 | $0 |
| 2012 | $1,913 | $35,300 | $8,300 | $27,000 |
Source: Public Records
Map
Nearby Homes
- 13949 Farley
- 12864 Berwyn
- 26235 Ross Dr
- 13965 Minock Dr
- 14041 Minock Dr
- 26561 Kendall Ct
- 24777 Ashley Ct Unit 5
- 14355 Brady
- 24790 Ashley Ct Unit 23
- 13973 Dixie
- 12838 Sarasota
- 25587 Ivanhoe
- 24629 Westgate Dr
- 13985 Breakfast Dr
- 14248 Dixie
- 14910 Aubrey
- 13221 Columbia
- 25917 Southwestern Hwy
- 14247 Brook Dr
- 14328 Brook Dr
- 25722 Schoolcraft
- 25718 Schoolcraft
- 25714 Schoolcraft
- 13941 Royal Grand
- 13944 Beech Daly Rd
- 13949 Royal Grand
- 13956 Beech Daly Rd Unit Bldg-Unit
- 13956 Beech Daly Rd
- 13969 Royal Grand
- 13929 Beech Daly Rd
- 13949 Beech Daly Rd
- 13976 Beech Daly Rd
- 13930 Royal Grand
- 25638 Schoolcraft
- 25638 Schoolcraft
- 25638 Schoolcraft
- 25638 Schoolcraft
- 25638 Schoolcraft
- 13985 Royal Grand
- 13965 Beech Daly Rd