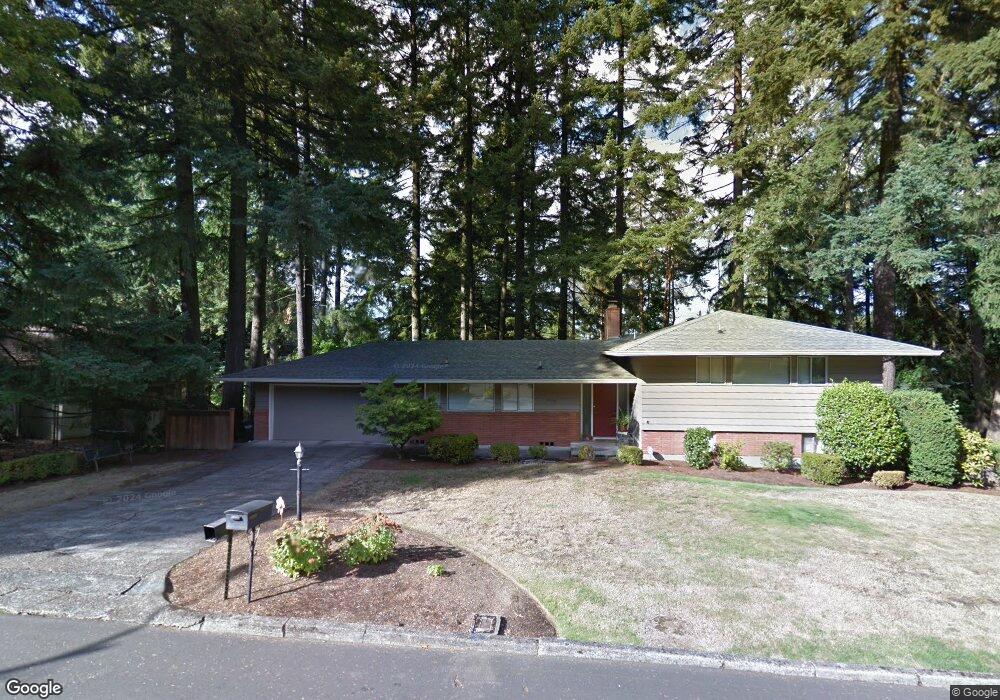
13935 SW Hargis Rd Beaverton, OR 97008
Highland NeighborhoodEstimated Value: $603,249 - $617,000
3
Beds
7
Baths
1,762
Sq Ft
$345/Sq Ft
Est. Value
About This Home
This home is located at 13935 SW Hargis Rd, Beaverton, OR 97008 and is currently estimated at $607,562, approximately $344 per square foot. 13935 SW Hargis Rd is a home located in Washington County with nearby schools including Fir Grove Elementary School, Highland Park Middle School, and Southridge High School.
Ownership History
Date
Name
Owned For
Owner Type
Purchase Details
Closed on
Mar 8, 2015
Sold by
Jacobs Kenneth A and Jacobs Susan K
Bought by
Jacobs Susan K
Current Estimated Value
Purchase Details
Closed on
Jan 24, 2002
Sold by
Jacobs Kenneth A
Bought by
Jacobs Kenneth A and Jacobs Susan K
Home Financials for this Owner
Home Financials are based on the most recent Mortgage that was taken out on this home.
Original Mortgage
$178,400
Outstanding Balance
$71,674
Interest Rate
6.95%
Estimated Equity
$535,888
Purchase Details
Closed on
Apr 17, 2000
Sold by
Poindexter Don G
Bought by
Ensley Randall Gordon and Ensley Sharon Claire
Home Financials for this Owner
Home Financials are based on the most recent Mortgage that was taken out on this home.
Original Mortgage
$192,545
Interest Rate
8.24%
Create a Home Valuation Report for This Property
The Home Valuation Report is an in-depth analysis detailing your home's value as well as a comparison with similar homes in the area
Home Values in the Area
Average Home Value in this Area
Purchase History
| Date | Buyer | Sale Price | Title Company |
|---|---|---|---|
| Jacobs Susan K | -- | None Available | |
| Jacobs Kenneth A | -- | Chicago Title Insurance Co | |
| Jacobs Kenneth A | $223,000 | Chicago Title Insurance Co | |
| Ensley Randall Gordon | $198,500 | Chicago Title Insurance Co |
Source: Public Records
Mortgage History
| Date | Status | Borrower | Loan Amount |
|---|---|---|---|
| Open | Jacobs Kenneth A | $178,400 | |
| Previous Owner | Ensley Randall Gordon | $192,545 | |
| Closed | Jacobs Kenneth A | $44,600 |
Source: Public Records
Tax History Compared to Growth
Tax History
| Year | Tax Paid | Tax Assessment Tax Assessment Total Assessment is a certain percentage of the fair market value that is determined by local assessors to be the total taxable value of land and additions on the property. | Land | Improvement |
|---|---|---|---|---|
| 2026 | $6,286 | $306,860 | -- | -- |
| 2025 | $6,286 | $297,930 | -- | -- |
| 2024 | $5,730 | $297,810 | -- | -- |
| 2023 | $5,730 | $271,120 | $0 | $0 |
| 2022 | $5,484 | $271,120 | $0 | $0 |
| 2021 | $5,292 | $255,570 | $0 | $0 |
| 2020 | $5,131 | $248,130 | $0 | $0 |
| 2019 | $4,969 | $240,910 | $0 | $0 |
| 2018 | $4,810 | $233,900 | $0 | $0 |
| 2017 | $4,631 | $227,090 | $0 | $0 |
| 2016 | $4,469 | $220,480 | $0 | $0 |
| 2015 | $4,303 | $214,060 | $0 | $0 |
| 2014 | -- | $207,830 | $0 | $0 |
Source: Public Records
Map
Nearby Homes
- 13820 SW Hart Rd
- 13525 SW Fircrest Ct
- 13465 SW Lancewood St
- 13920 SW Secretariet Ln
- 14375 SW Wilson Dr
- 13235 SW Barberry Dr
- 7135 SW Wilson Ave
- 14075 SW Kentucky Place
- 8100 SW 147th Terrace
- 7144 SW Murray Blvd Unit 107
- 7116 SW Murray Blvd
- 7830 SW Murray Blvd
- 8225 SW Gearhart Dr
- 13850 SW Martingale Ct
- 14775 SW Citrine Way
- 14320 SW Cherryhill Dr
- 14770 SW Citrine Way
- 12720 SW Brockman St
- 8800 SW 147th Terrace Unit 103
- 9125 SW Davies Rd
- 4225 SW Kimberly Dr
- 13975 SW Hargis Rd
- 7775 SW Danielle Ave
- 13895 SW Hargis Rd
- 13970 SW Wilson Dr
- 7810 SW Danielle Ave
- 14015 SW Hargis Rd
- 13930 SW Hargis Rd
- 13990 SW Wilson Dr
- 13970 SW Hargis Rd
- 7790 SW Wilson Ave
- 13880 SW Hargis Rd
- 13835 SW Hargis Rd
- 14010 SW Hargis Rd
- 14055 SW Hargis Rd
- 7725 SW Danielle Ave
- 7790 SW 140th Ave
- 7720 SW Danielle Ave
- 13840 SW Hargis Rd
- 7780 SW Wilson Ave