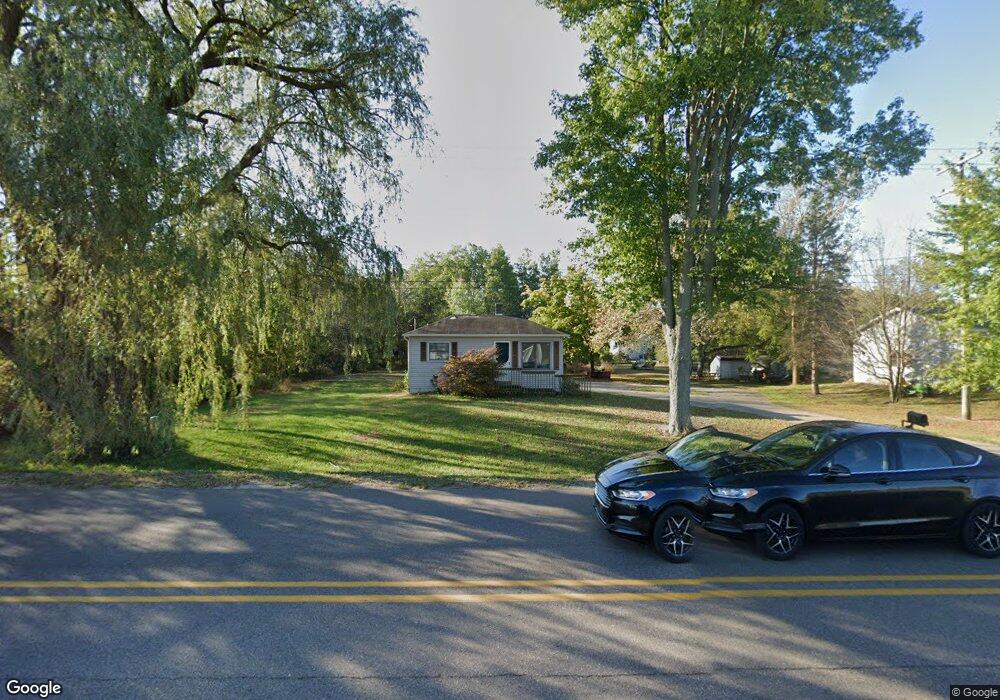
13936 Quincy St Holland, MI 49424
Estimated Value: $189,000 - $262,000
2
Beds
1
Bath
610
Sq Ft
$381/Sq Ft
Est. Value
About This Home
This home is located at 13936 Quincy St, Holland, MI 49424 and is currently estimated at $232,517, approximately $381 per square foot. 13936 Quincy St is a home located in Ottawa County with nearby schools including Pine Creek Elementary School, Harbor Lights Middle School, and West Ottawa High School.
Ownership History
Date
Name
Owned For
Owner Type
Purchase Details
Closed on
Oct 27, 2011
Sold by
Federal Home Loan Mortgage Corporation
Bought by
Sanders Timothy and Sanders Jamie
Current Estimated Value
Purchase Details
Closed on
Sep 23, 2010
Sold by
Sterken Brian L
Bought by
Federal Home Loan Mortgage Corp
Purchase Details
Closed on
Feb 19, 2003
Sold by
Vorenkamp Arie
Bought by
Sterken Brian
Home Financials for this Owner
Home Financials are based on the most recent Mortgage that was taken out on this home.
Original Mortgage
$5,000
Interest Rate
6%
Mortgage Type
Credit Line Revolving
Create a Home Valuation Report for This Property
The Home Valuation Report is an in-depth analysis detailing your home's value as well as a comparison with similar homes in the area
Home Values in the Area
Average Home Value in this Area
Purchase History
| Date | Buyer | Sale Price | Title Company |
|---|---|---|---|
| Sanders Timothy | $25,000 | Attorneys Title Agency Llc | |
| Federal Home Loan Mortgage Corp | $69,302 | None Available | |
| Sterken Brian | $92,300 | Chicago Title |
Source: Public Records
Mortgage History
| Date | Status | Borrower | Loan Amount |
|---|---|---|---|
| Previous Owner | Sterken Brian | $5,000 | |
| Previous Owner | Sterken Brian | $73,800 |
Source: Public Records
Tax History Compared to Growth
Tax History
| Year | Tax Paid | Tax Assessment Tax Assessment Total Assessment is a certain percentage of the fair market value that is determined by local assessors to be the total taxable value of land and additions on the property. | Land | Improvement |
|---|---|---|---|---|
| 2025 | $2,162 | $83,000 | $0 | $0 |
| 2024 | $1,827 | $74,100 | $0 | $0 |
| 2023 | $1,753 | $68,400 | $0 | $0 |
| 2022 | $2,025 | $64,300 | $0 | $0 |
| 2021 | $1,967 | $60,000 | $0 | $0 |
| 2020 | $1,892 | $58,200 | $0 | $0 |
| 2019 | $1,860 | $30,300 | $0 | $0 |
| 2018 | $1,758 | $45,500 | $15,200 | $30,300 |
| 2017 | $1,728 | $43,100 | $0 | $0 |
| 2016 | $1,716 | $39,200 | $0 | $0 |
| 2015 | $1,658 | $36,700 | $0 | $0 |
| 2014 | $1,658 | $35,100 | $0 | $0 |
Source: Public Records
Map
Nearby Homes
- Integrity 1610 Plan at Silverwater
- Integrity 1250 Plan at Silverwater
- Integrity 1880 Plan at Silverwater
- Integrity 1560 Plan at Silverwater
- Traditions 2900 V8.2b Plan at Silverwater
- Integrity 1605 Plan at Silverwater
- Elements 2700 Plan at Silverwater
- Integrity 1530 Plan at Silverwater
- Integrity 1800 Plan at Silverwater
- Traditions 2800 V8.0b Plan at Silverwater
- Integrity 2060 Plan at Silverwater
- Integrity 2280 Plan at Silverwater
- Integrity 1520 Plan at Silverwater
- Elements 2390 Plan at Silverwater
- Integrity 1830 Plan at Silverwater
- Elements 1800 Plan at Silverwater
- Elements 1870 Plan at Silverwater
- Traditions 3390 V8.2b Plan at Silverwater
- Integrity 2190 Plan at Silverwater
- Integrity 2000 Plan at Silverwater