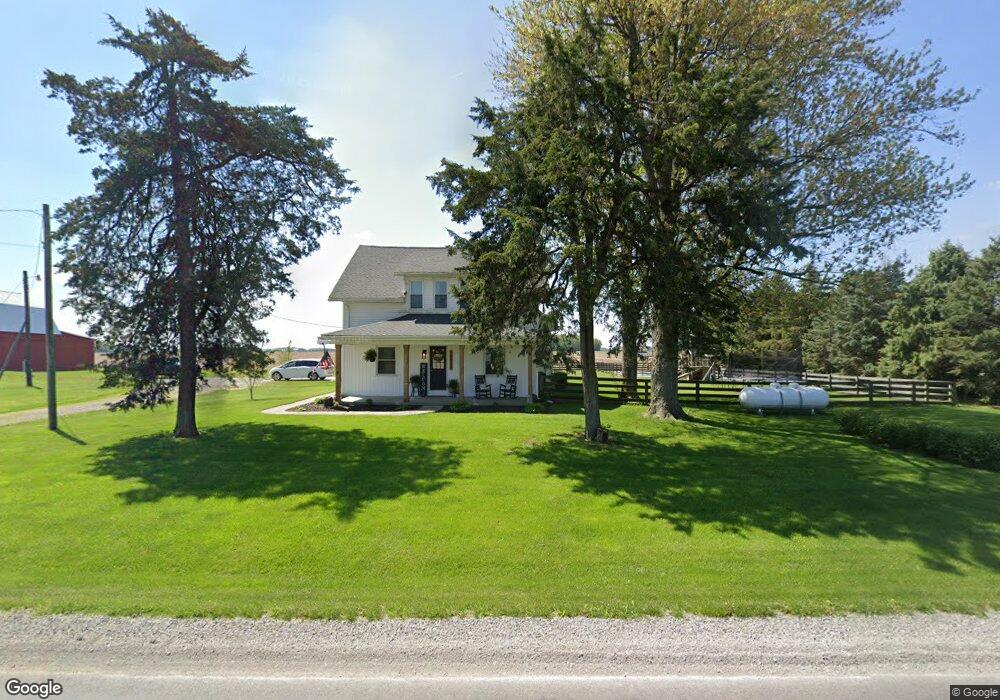
13939 State Rd Delphos, OH 45833
Estimated Value: $254,000 - $334,000
4
Beds
1
Bath
2,084
Sq Ft
$138/Sq Ft
Est. Value
About This Home
This home is located at 13939 State Rd, Delphos, OH 45833 and is currently estimated at $286,648, approximately $137 per square foot. 13939 State Rd is a home located in Allen County with nearby schools including Delphos St. John's High School.
Ownership History
Date
Name
Owned For
Owner Type
Purchase Details
Closed on
Jan 11, 2023
Sold by
Alexander Stacy J and Mcadams Alex A
Bought by
Mcadams Alex A and Mcadams Stacy J
Current Estimated Value
Purchase Details
Closed on
May 5, 2016
Sold by
Fischer Margaret F and Fischer Mark G
Bought by
Mcadams Alex A and Alexander Stacy J
Purchase Details
Closed on
Feb 9, 2012
Sold by
Fischer Margaret F and Fischer Margaret
Bought by
Fischer Margaret F and Fischer Mark G
Purchase Details
Closed on
Apr 16, 2010
Sold by
Fischer Anthony R and Fischer Ladonna M
Bought by
Fischer Margaret F
Home Financials for this Owner
Home Financials are based on the most recent Mortgage that was taken out on this home.
Original Mortgage
$105,000
Interest Rate
5.03%
Mortgage Type
Purchase Money Mortgage
Purchase Details
Closed on
Feb 1, 1984
Bought by
Fischer Anthony R
Create a Home Valuation Report for This Property
The Home Valuation Report is an in-depth analysis detailing your home's value as well as a comparison with similar homes in the area
Purchase History
| Date | Buyer | Sale Price | Title Company |
|---|---|---|---|
| Mcadams Alex A | -- | None Listed On Document | |
| Mcadams Alex A | $150,000 | None Available | |
| Fischer Margaret F | -- | Attorney | |
| Fischer Margaret F | $140,000 | Attorney | |
| Fischer Anthony R | $30,000 | -- |
Source: Public Records
Mortgage History
| Date | Status | Borrower | Loan Amount |
|---|---|---|---|
| Previous Owner | Fischer Margaret F | $105,000 |
Source: Public Records
Tax History
| Year | Tax Paid | Tax Assessment Tax Assessment Total Assessment is a certain percentage of the fair market value that is determined by local assessors to be the total taxable value of land and additions on the property. | Land | Improvement |
|---|---|---|---|---|
| 2024 | $2,417 | $78,900 | $13,830 | $65,070 |
| 2023 | $1,993 | $61,150 | $10,710 | $50,440 |
| 2022 | $1,793 | $53,900 | $10,710 | $43,190 |
| 2021 | $1,797 | $53,900 | $10,710 | $43,190 |
| 2020 | $1,489 | $46,310 | $10,080 | $36,230 |
| 2019 | $1,489 | $46,310 | $10,080 | $36,230 |
| 2018 | $1,210 | $37,770 | $10,080 | $27,690 |
| 2017 | $1,214 | $35,250 | $10,080 | $25,170 |
| 2016 | $1,108 | $33,540 | $8,370 | $25,170 |
| 2015 | $994 | $33,540 | $8,370 | $25,170 |
| 2014 | $994 | $29,610 | $7,700 | $21,910 |
| 2013 | $1,000 | $29,610 | $7,700 | $21,910 |
Source: Public Records
Map
Nearby Homes
- 827 S Washington St
- 424 S Canal St
- 483 S Franklin St
- 221 S Main St
- 709 W 4th St
- 409 N Bredeick St
- 537 / 539 Toomey
- 201 E 5th St
- 629 N Main St
- 10429 Ohio 66
- 702 N Main St
- 610 N Washington St
- 628 N Pierce St
- 821 E 3rd St
- 7110 Elida Rd
- 1000 Colettas Way
- 19195 State Rd
- 21302 Masters Rd
- 6800 N Defiance Trail
- 112 W Railroad St
Your Personal Tour Guide
Ask me questions while you tour the home.