Estimated Value: $477,000 - $522,000
4
Beds
3
Baths
3,003
Sq Ft
$168/Sq Ft
Est. Value
About This Home
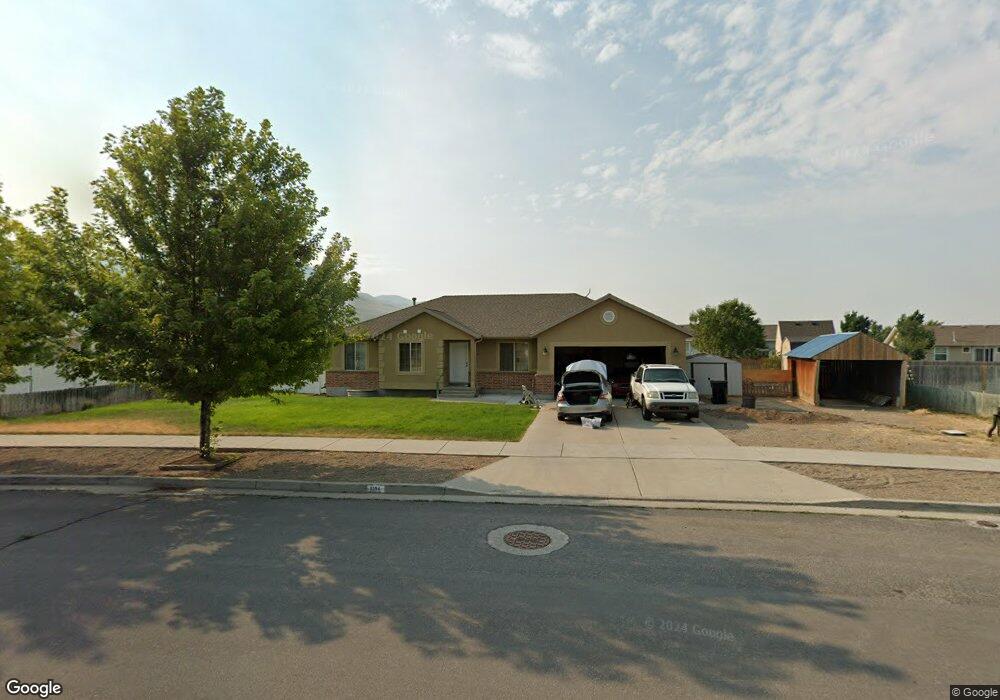
This home is located at 1394 E 100 S, Hyrum, UT 84319 and is currently estimated at $504,025, approximately $167 per square foot. 1394 E 100 S is a home located in Cache County with nearby schools including Canyon School, South Cache Middle School, and Mountain Crest High School.
Ownership History
Date
Name
Owned For
Owner Type
Purchase Details
Closed on
Mar 27, 2024
Sold by
Cheryl Sundberg Living Trust and Sundberg Cheryl
Bought by
Kaw Hser Nay and El Nan Ei
Current Estimated Value
Home Financials for this Owner
Home Financials are based on the most recent Mortgage that was taken out on this home.
Original Mortgage
$462,962
Outstanding Balance
$455,023
Interest Rate
6.77%
Mortgage Type
FHA
Estimated Equity
$49,002
Purchase Details
Closed on
Jul 10, 2023
Sold by
Sundberg Cheryl
Bought by
Cheryl Sundberg Living Trust and Sundberg
Purchase Details
Closed on
May 2, 2011
Sold by
Sundberg Byron
Bought by
Sundberg Byron and Sundberg Cheryl
Purchase Details
Closed on
Dec 17, 2007
Sold by
Jpw Development Llc
Bought by
Sundberg Byron
Purchase Details
Closed on
Feb 22, 2007
Sold by
Mountain Valley Development Inc
Bought by
Jpw Development Llc
Create a Home Valuation Report for This Property
The Home Valuation Report is an in-depth analysis detailing your home's value as well as a comparison with similar homes in the area
Home Values in the Area
Average Home Value in this Area
Purchase History
| Date | Buyer | Sale Price | Title Company |
|---|---|---|---|
| Kaw Hser Nay | -- | Us Title | |
| Cheryl Sundberg Living Trust | -- | None Listed On Document | |
| Cheryl Sundberg Living Trust | -- | None Listed On Document | |
| Sundberg Byron | -- | Hickman Land Title Co | |
| Sundberg Byron | -- | Hickman Land Title Company | |
| Jpw Development Llc | -- | Hickman Land Title Company |
Source: Public Records
Mortgage History
| Date | Status | Borrower | Loan Amount |
|---|---|---|---|
| Open | Kaw Hser Nay | $462,962 |
Source: Public Records
Tax History Compared to Growth
Tax History
| Year | Tax Paid | Tax Assessment Tax Assessment Total Assessment is a certain percentage of the fair market value that is determined by local assessors to be the total taxable value of land and additions on the property. | Land | Improvement |
|---|---|---|---|---|
| 2025 | $1,977 | $283,880 | $0 | $0 |
| 2024 | $2,121 | $284,400 | $0 | $0 |
| 2023 | $2,029 | $260,150 | $0 | $0 |
| 2022 | $2,118 | $260,150 | $0 | $0 |
| 2021 | $1,720 | $325,594 | $77,700 | $247,894 |
| 2020 | $1,651 | $293,260 | $77,700 | $215,560 |
| 2019 | $1,559 | $260,510 | $44,950 | $215,560 |
| 2018 | $1,470 | $237,415 | $44,950 | $192,465 |
| 2017 | $1,498 | $125,540 | $0 | $0 |
| 2016 | $1,532 | $101,430 | $0 | $0 |
| 2015 | $1,241 | $101,430 | $0 | $0 |
| 2014 | $1,213 | $101,430 | $0 | $0 |
| 2013 | -- | $101,430 | $0 | $0 |
Source: Public Records
Map
Nearby Homes
- 1396 E 100 S Unit 131
- 1396 E 100 S
- 1392 E 100 S
- 1391 E 150 S
- 1393 E 150 S
- 1395 E 100 S Unit 134
- 1385 E 150 S
- 1395 E 150 S
- 1393 E 100 S
- 1398 E 100 S Unit 129
- 1398 E 100 S
- 1376 E 100 S
- 1397 E 100 S
- 1379 E 100 S
- 1371 E 150 S
- 1397 E 150 S
- 1397 E 150 S Unit 125
- 1400 E 100 S
- 116 S 1400 E
- 116 S 1400 E Unit 128