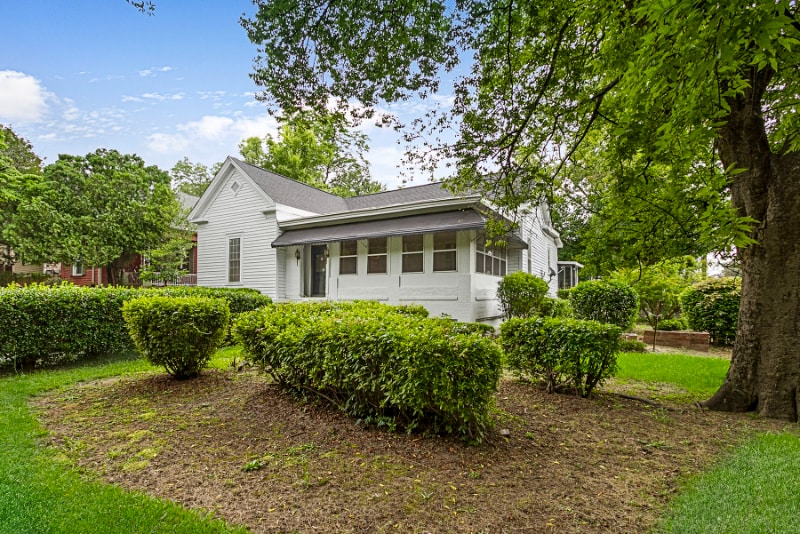
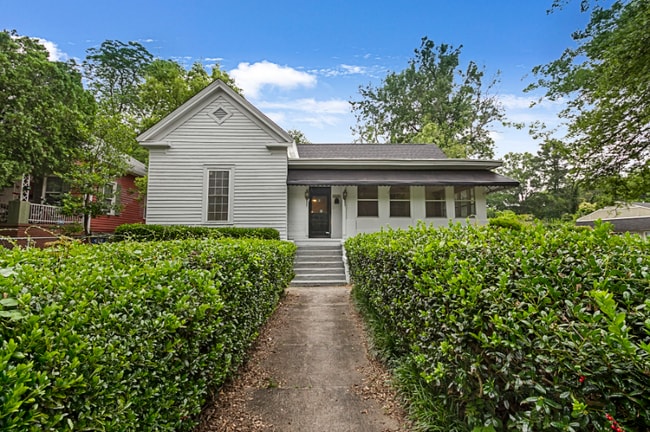
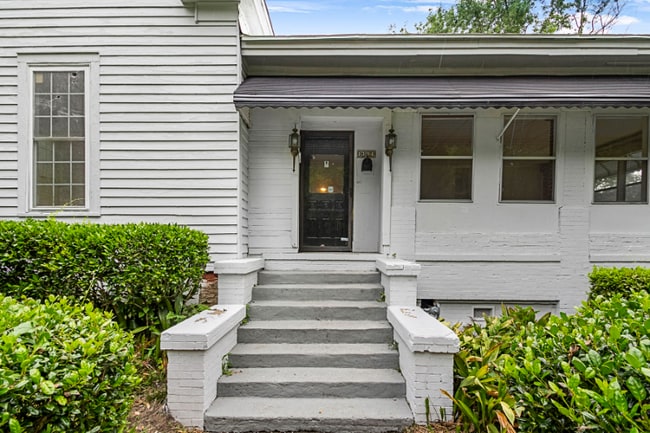
NOT LISTED FOR SALE

Estimated Value: $83,000 - $191,000

6 Beds
1 Bath
277 Sq Ft
$568/Sq Ft Est. Value

Last Sold December 13, 2024

Last sale price $70,000 $253 Per Sq Ft

Est. 125% increase in value since last sale

Current estimated payment $909/month

About This Home

This home is located at 1394 Ross St, Macon, GA 31201 and is currently estimated at $157,201, approximately $567 per square foot. 1394 Ross St is a home with nearby schools including Ingram-Pye Elementary School, Southwest High School, and St. Joseph's Catholic School.

Ownership History

Date Name Owned For Owner Type

Purchase Details

Listed on
Dec 13, 2024
Closed on
Nov 26, 2024
Sold by
Hugley Kenneth
Bought by
Ez Ga Properties Llc
Seller's Agent
Essie Miller
Keller Williams Realty Middle Georgia
Buyer's Agent
Brokered Agent
Brokered Sale
List Price
$70,000
Sold Price
$70,000
Views
1
Current Estimated Value
$157,201

Home Financials for this Owner

Home Financials are based on the most recent Mortgage that was taken out on this home.
Estimated Appreciation
$87,201
Avg. Annual Appreciation
97.36%
Original Mortgage
$167,000
Interest Rate
6.72%
Mortgage Type
Construction

Purchase Details

Closed on
Jun 21, 2010
Sold by
Hugley Oscar and Hugley Samuel
Bought by
Hugley Kenneth
Source: Public Records

Range of Values:

--
Value Increase
--
Percent Increase
--
Adjusted for Inflation
Collateral Analytics

Collateral Analytics Collateral Analytics AVMs (Automated Valuation Model) employ a number of statistical approaches combined with neighborhood-specific comparable selection guarantees the most up-to-date and precise valuations.

Not Available

Collateral Analytics does not have data for the current month. Please view the chart for historical values.

ICE

ICE Mortgage Technology ICE Mortgage Technology’s AVM (Automated Valuation Model) is a state-of-the-art online residential property valuation tool that provides a quick and accurate estimate of the value of almost any home in the U.S.

Not Available

ICE Mortgage Technology does not have data for the current month. Please view the chart for historical values.

First American

First American First American Data & Analytics’ next-generation AVM combines unrivaled data assets with a blended ensemble of valuation models to produce highly accurate, reliable valuations you can trust.

Not Available

First American does not have data for the current month. Please view the chart for historical values.

Quantarium

Quantarium Quantarium’s valuation service, repeatedly proven the industry’s most accurate and comprehensive, is supercharged with a self-learning and auto-tuning AI engine that continually becomes smarter and more accurate as it processes daily inputs from the industry’s leading RE data lake.

Not Available

Quantarium does not have data for the current month. Please view the chart for historical values.

Average Value
Not Available
List Price
Sold Price
Create a Home Valuation Report for This Property
The Home Valuation Report is an in-depth analysis detailing your home's value as well as a comparison with similar homes in the area

Home Values in the Area

Source: Public Records

Average Home Value in this Area


Source: Public Records

Purchase History

Date Buyer Sale Price Title Company
Ez Ga Properties Llc $70,000 National Title Services Llc
Hugley Kenneth -- None Available
Source: Public Records

Mortgage History

Date Status Borrower Loan Amount
Closed Ez Ga Properties Llc $167,000
Source: Public Records

Property History

Date Event Price List to Sale Price per Sq Ft Prior Sale
12/13/2024 12/13/24 Sold $70,000 0.0% $30 / Sq Ft View Prior Sale
12/13/2024 12/13/24 Pending -- -- --
12/13/2024 12/13/24 For Sale $70,000 -- $30 / Sq Ft

Tax History

Year Tax Paid Tax Assessment Tax Assessment Total Assessment is a certain percentage of the fair market value that is determined by local assessors to be the total taxable value of land and additions on the property. Land Improvement
2025 $1,185 $48,231 $6,600 $41,631
2024 $1,225 $48,231 $6,600 $41,631
2023 $1,033 $40,693 $6,000 $34,693
2022 $1,147 $33,124 $4,506 $28,618
2021 $959 $25,241 $3,466 $21,775
2020 $980 $25,241 $3,466 $21,775
2019 $988 $25,241 $3,466 $21,775
2018 $1,693 $25,241 $3,466 $21,775
2017 $907 $24,204 $3,466 $20,738
2016 $837 $24,204 $3,466 $20,738
2015 $1,185 $24,204 $3,466 $20,738
2014 $1,363 $24,204 $3,466 $20,738
Source: Public Records

Agents Affiliated with this Home

  • Section Image
See All Agents

Map

Your Personal Tour Guide

Ask me questions while you tour the home.