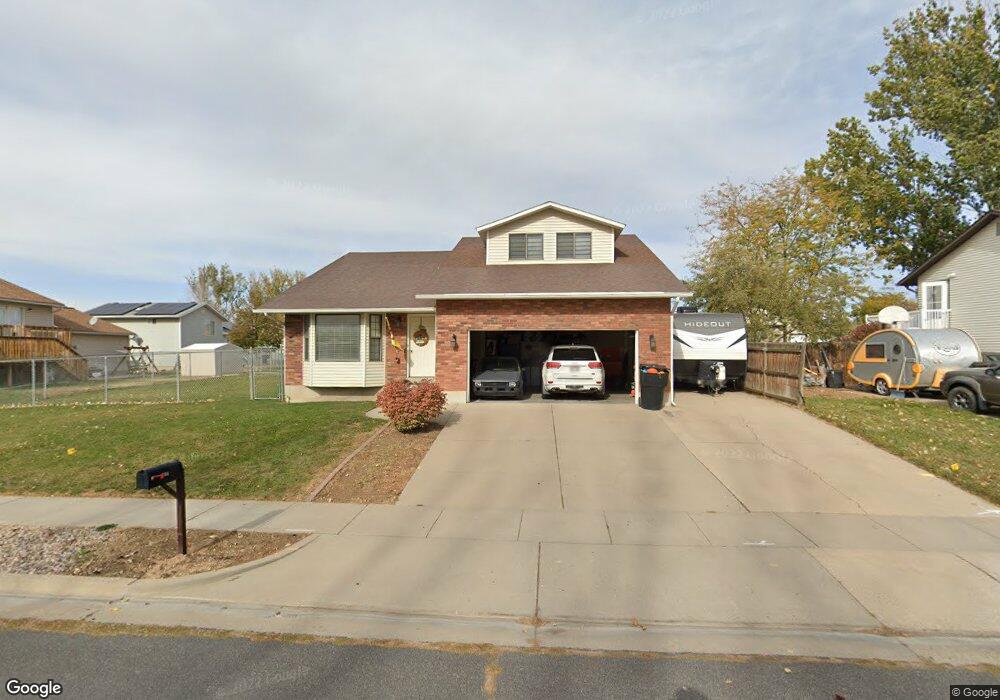
1394 W 725 N Clearfield, UT 84015
Estimated Value: $443,000 - $461,000
4
Beds
2
Baths
2,547
Sq Ft
$176/Sq Ft
Est. Value
About This Home
This home is located at 1394 W 725 N, Clearfield, UT 84015 and is currently estimated at $448,788, approximately $176 per square foot. 1394 W 725 N is a home located in Davis County with nearby schools including Holt Elementary School, North Davis Junior High School, and Syracuse High School.
Ownership History
Date
Name
Owned For
Owner Type
Purchase Details
Closed on
Dec 18, 2019
Sold by
Page Taylor P
Bought by
Page Taylor P and Page Kailah B
Current Estimated Value
Home Financials for this Owner
Home Financials are based on the most recent Mortgage that was taken out on this home.
Original Mortgage
$241,000
Outstanding Balance
$212,476
Interest Rate
3.6%
Mortgage Type
New Conventional
Estimated Equity
$236,312
Purchase Details
Closed on
Jan 30, 2018
Sold by
Roberts David Z and Roberts Amy A
Bought by
Page Taylor
Purchase Details
Closed on
May 29, 2014
Sold by
Kozlowski David K
Bought by
Roberts David Z and Roberts Amy A
Home Financials for this Owner
Home Financials are based on the most recent Mortgage that was taken out on this home.
Original Mortgage
$199,192
Interest Rate
4.23%
Mortgage Type
VA
Create a Home Valuation Report for This Property
The Home Valuation Report is an in-depth analysis detailing your home's value as well as a comparison with similar homes in the area
Home Values in the Area
Average Home Value in this Area
Purchase History
| Date | Buyer | Sale Price | Title Company |
|---|---|---|---|
| Page Taylor P | -- | Stewart Title Ins Ag | |
| Page Taylor | -- | Stewart Title | |
| Roberts David Z | -- | Mountain America Title |
Source: Public Records
Mortgage History
| Date | Status | Borrower | Loan Amount |
|---|---|---|---|
| Open | Page Taylor P | $241,000 | |
| Previous Owner | Roberts David Z | $199,192 |
Source: Public Records
Tax History Compared to Growth
Tax History
| Year | Tax Paid | Tax Assessment Tax Assessment Total Assessment is a certain percentage of the fair market value that is determined by local assessors to be the total taxable value of land and additions on the property. | Land | Improvement |
|---|---|---|---|---|
| 2025 | $2,339 | $224,950 | $91,346 | $133,604 |
| 2024 | $2,259 | $218,350 | $100,306 | $118,044 |
| 2023 | $2,024 | $362,000 | $114,302 | $247,698 |
| 2022 | $2,157 | $213,400 | $69,701 | $143,699 |
| 2021 | $1,976 | $290,000 | $87,625 | $202,375 |
| 2020 | $1,728 | $251,000 | $74,651 | $176,349 |
| 2019 | $1,684 | $239,000 | $86,875 | $152,125 |
| 2018 | $1,549 | $216,000 | $73,331 | $142,669 |
| 2016 | $1,432 | $103,070 | $28,596 | $74,474 |
| 2015 | $1,385 | $94,820 | $28,596 | $66,224 |
| 2014 | $1,408 | $97,871 | $28,596 | $69,275 |
| 2013 | -- | $93,338 | $27,143 | $66,195 |
Source: Public Records
Map
Nearby Homes
- 563 N 1350 W Unit 139
- 1350 W 300 N Unit 49
- 1350 W 300 N Unit 38
- 1350 W 300 N Unit 29
- 526 N 1350 W Unit 204
- 1337 W 550 N Unit 195
- 1652 W 560 N
- 620 N 1100 W
- 423 N 1250 W Unit 118
- 1038 W 800 N
- 417 N 1200 W Unit 84
- 984 N 1100 W
- 1805 W 675 N
- 1827 W 775 N
- 1832 W 725 N
- 1242 W 1075 N
- 1122 N 1500 W
- 1774 W 400 N
- 1692 W 300 N
- 780 Barlow St