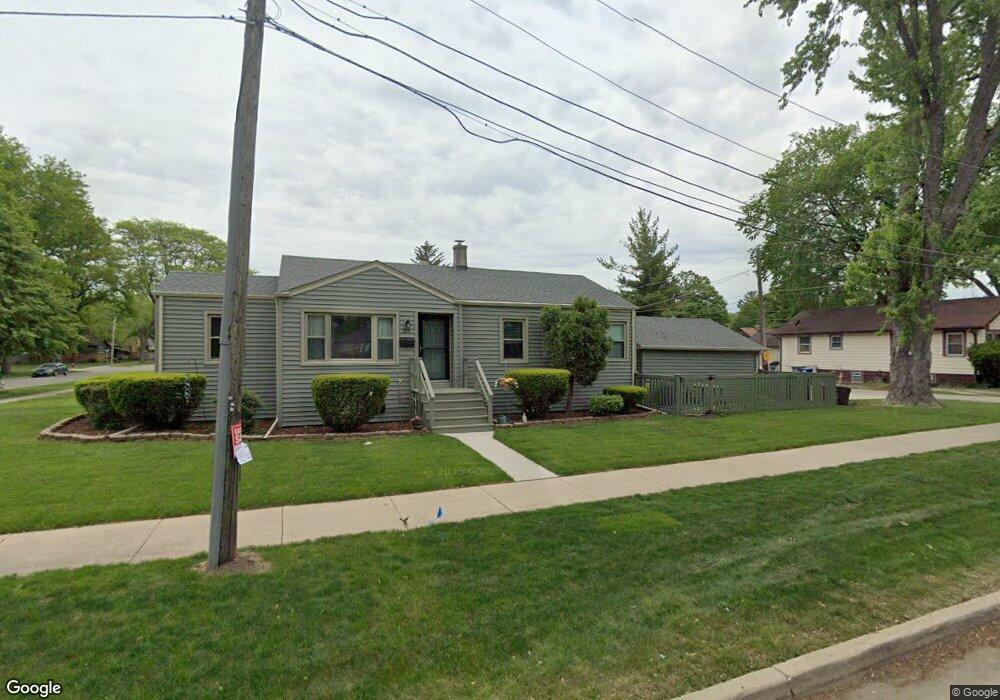
1395 E Algonquin Rd Des Plaines, IL 60016
Estimated Value: $280,522 - $320,000
2
Beds
1
Bath
886
Sq Ft
$343/Sq Ft
Est. Value
About This Home
This home is located at 1395 E Algonquin Rd, Des Plaines, IL 60016 and is currently estimated at $304,131, approximately $343 per square foot. 1395 E Algonquin Rd is a home located in Cook County with nearby schools including Central Elementary School, Chippewa Middle School, and Maine West High School.
Ownership History
Date
Name
Owned For
Owner Type
Purchase Details
Closed on
Mar 18, 2022
Sold by
O'Malley Mary F and O'Malley Michael K
Bought by
O'Malley Mary F and O'Malley Y
Current Estimated Value
Purchase Details
Closed on
Jan 30, 2022
Sold by
O'Malley Mary F and O'Malley Michael K
Bought by
O'Malley Mary F and O'Malley Y
Purchase Details
Closed on
Apr 15, 2002
Sold by
Omalley Michael and Omalley Mary
Bought by
Omalley Michael K and Omalley Mary F
Create a Home Valuation Report for This Property
The Home Valuation Report is an in-depth analysis detailing your home's value as well as a comparison with similar homes in the area
Home Values in the Area
Average Home Value in this Area
Purchase History
| Date | Buyer | Sale Price | Title Company |
|---|---|---|---|
| O'Malley Mary F | -- | -- | |
| O'Malley Mary F | -- | -- | |
| Omalley Michael K | -- | -- |
Source: Public Records
Tax History
| Year | Tax Paid | Tax Assessment Tax Assessment Total Assessment is a certain percentage of the fair market value that is determined by local assessors to be the total taxable value of land and additions on the property. | Land | Improvement |
|---|---|---|---|---|
| 2025 | $2,124 | $13,250 | $2,689 | $10,561 |
| 2024 | $2,124 | $11,038 | $2,390 | $8,648 |
| 2023 | $2,048 | $11,038 | $2,390 | $8,648 |
| 2022 | $2,048 | $11,038 | $2,390 | $8,648 |
| 2021 | $1,633 | $8,311 | $1,942 | $6,369 |
| 2020 | $1,668 | $8,311 | $1,942 | $6,369 |
| 2019 | $1,656 | $9,240 | $1,942 | $7,298 |
| 2018 | $1,600 | $8,441 | $1,718 | $6,723 |
| 2017 | $1,587 | $8,441 | $1,718 | $6,723 |
| 2016 | $1,751 | $8,441 | $1,718 | $6,723 |
| 2015 | $2,240 | $8,720 | $1,494 | $7,226 |
| 2014 | $2,201 | $8,720 | $1,494 | $7,226 |
| 2013 | $2,137 | $8,720 | $1,494 | $7,226 |
Source: Public Records
Map
Nearby Homes
- 1380 Oakwood Ave Unit 306
- 1524 Oakwood Ave
- 1630 Henry Ave
- 905 Center St Unit B208
- 900 Center St Unit 3A
- 1700 E Forest Ave
- 1277 E Thacker St Unit 303
- 1048 E Walnut Ave
- 1638 Oakwood Ave
- 1649 Ashland Ave Unit 501
- 821 Lexington Cir E
- 787 Graceland Ave Unit 202B
- 1080 Bogart St
- 1600 E Thacker St Unit 513
- 1645 Illinois St
- 770 Pearson St Unit 808
- 750 Pearson St Unit 904
- 1689 S Elm St
- 1696 S Elm St
- 1394 Carol Ln
- 1395 E Algonquin Rd
- 1210 Center St
- 1222 Center St
- 1369 E Algonquin Rd
- 1234 Center St
- 1357 E Algonquin Rd
- 1357 E Algonquin Rd
- 1384 E Algonquin Rd
- 1384 E Algonquin Rd
- 1394 E Algonquin Rd
- 1374 E Algonquin Rd
- 1201 Center St
- 1219 Center St
- 1366 Van Buren Ave
- 1242 Center St
- 1353 E Algonquin Rd
- 1221 Center St
- 1358 Van Buren Ave
- 1195 Center St
- 1233 Center St
Your Personal Tour Guide
Ask me questions while you tour the home.