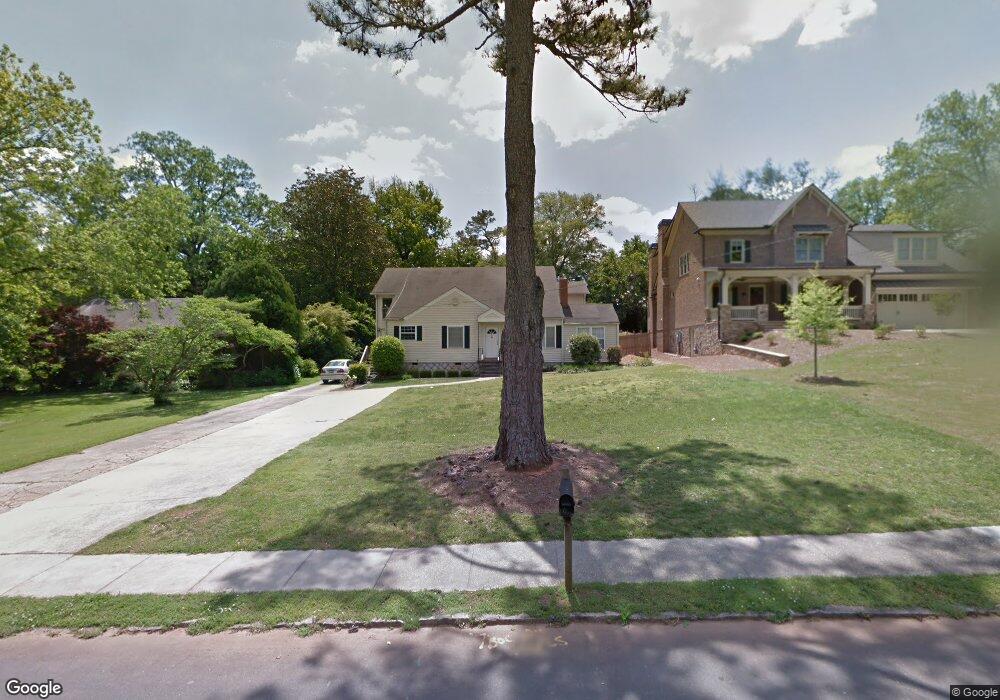
1395 Merry Ln NE Atlanta, GA 30329
Merry Hills NeighborhoodEstimated Value: $728,000 - $835,505
6
Beds
5
Baths
3,376
Sq Ft
$231/Sq Ft
Est. Value
About This Home
This home is located at 1395 Merry Ln NE, Atlanta, GA 30329 and is currently estimated at $781,376, approximately $231 per square foot. 1395 Merry Ln NE is a home located in DeKalb County with nearby schools including Briar Vista Elementary School, Druid Hills Middle School, and Druid Hills High School.
Ownership History
Date
Name
Owned For
Owner Type
Purchase Details
Closed on
Oct 22, 2001
Sold by
Yadgarova Berta
Bought by
Zughaier Susu
Current Estimated Value
Home Financials for this Owner
Home Financials are based on the most recent Mortgage that was taken out on this home.
Original Mortgage
$296,400
Outstanding Balance
$115,683
Interest Rate
6.85%
Mortgage Type
New Conventional
Estimated Equity
$665,693
Purchase Details
Closed on
Apr 13, 1999
Sold by
Klondike On The River Llc
Bought by
Niyazov Choice Homes Texas
Home Financials for this Owner
Home Financials are based on the most recent Mortgage that was taken out on this home.
Original Mortgage
$82,500
Interest Rate
6.98%
Mortgage Type
New Conventional
Purchase Details
Closed on
Dec 22, 1998
Sold by
Tuggle Alice A
Bought by
Niyazov Yakub
Home Financials for this Owner
Home Financials are based on the most recent Mortgage that was taken out on this home.
Original Mortgage
$82,500
Interest Rate
6.82%
Mortgage Type
New Conventional
Create a Home Valuation Report for This Property
The Home Valuation Report is an in-depth analysis detailing your home's value as well as a comparison with similar homes in the area
Home Values in the Area
Average Home Value in this Area
Purchase History
| Date | Buyer | Sale Price | Title Company |
|---|---|---|---|
| Zughaier Susu | $312,000 | -- | |
| Niyazov Choice Homes Texas | $17,900 | -- | |
| Niyazov Yakub | $110,000 | -- |
Source: Public Records
Mortgage History
| Date | Status | Borrower | Loan Amount |
|---|---|---|---|
| Open | Zughaier Susu | $296,400 | |
| Previous Owner | Niyazov Choice Homes Texas | $82,500 | |
| Previous Owner | Niyazov Yakub | $82,500 |
Source: Public Records
Tax History Compared to Growth
Tax History
| Year | Tax Paid | Tax Assessment Tax Assessment Total Assessment is a certain percentage of the fair market value that is determined by local assessors to be the total taxable value of land and additions on the property. | Land | Improvement |
|---|---|---|---|---|
| 2024 | $8,060 | $266,400 | $86,000 | $180,400 |
| 2023 | $8,060 | $234,200 | $70,400 | $163,800 |
| 2022 | $5,461 | $159,480 | $68,000 | $91,480 |
| 2021 | $6,331 | $190,240 | $68,000 | $122,240 |
| 2020 | $6,218 | $185,040 | $68,000 | $117,040 |
| 2019 | $4,205 | $124,240 | $68,000 | $56,240 |
| 2018 | $5,494 | $161,280 | $68,000 | $93,280 |
| 2017 | $4,958 | $140,920 | $21,600 | $119,320 |
| 2016 | $5,308 | $154,760 | $21,600 | $133,160 |
| 2014 | $4,418 | $130,280 | $21,600 | $108,680 |
Source: Public Records
Map
Nearby Homes
- 1461 Wembley Ct NE
- 1949 Townsend Ct NE Unit 22
- 1435 Druid Manor Blvd NE
- 1438 Druid Manor Blvd NE
- 1443 Fama Dr NE
- 1851 Fern Creek Ln NE
- 1185 Houston Mill Rd NE
- 1463 Edgebrook Ct NE Unit 14
- 1482 N Crossing Cir NE
- 2132 Clairmont Rd
- 1404 N Crossing Dr NE
- 1155 Mcconnell Dr
- 2077 Trailmark Dr
- 1104 Mason Woods Dr NE
- 2233 Clairmont Rd NE
- 1514 Woodbridge Way NE
- 2034 Pine Forest Dr NE
- 1406 Winston Place
- 2076 Patterson Park Rd
- 1401 Merry Ln NE
- 1389 Merry Ln NE
- 1407 Merry Ln NE
- 1385 Merry Ln NE
- 2178 Lavista Rd NE
- 2172 Lavista Rd NE
- 1413 Merry Ln NE
- 1377 Merry Ln NE
- 2166 Lavista Rd NE
- 1394 Merry Ln NE
- 1400 Merry Ln NE
- 1388 Merry Ln NE
- 1406 Merry Ln NE
- 1371 Merry Ln NE
- 2160 Lavista Rd NE
- 2801 N Druid Hills Rd NE
- 1376 Merry Ln NE
- 1471 Wembley Ct NE
- 1469 Wembley Ct NE
- 1363 Merry Ln NE