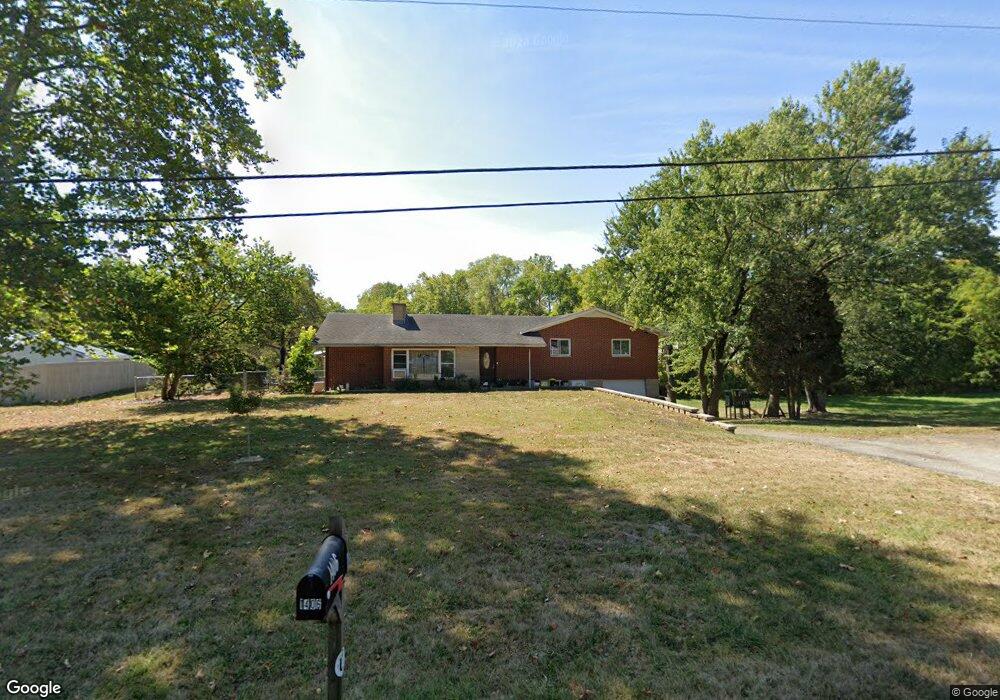
1395 Rainbow Dr NE Lancaster, OH 43130
Estimated Value: $229,000 - $361,000
3
Beds
1
Bath
1,640
Sq Ft
$183/Sq Ft
Est. Value
About This Home
This home is located at 1395 Rainbow Dr NE, Lancaster, OH 43130 and is currently estimated at $300,346, approximately $183 per square foot. 1395 Rainbow Dr NE is a home located in Fairfield County with nearby schools including Medill Elementary School, Thomas Ewing Junior High School, and Lancaster High School.
Ownership History
Date
Name
Owned For
Owner Type
Purchase Details
Closed on
Nov 1, 2017
Sold by
Catalan Stacy C and Smith Shannon W
Bought by
Smith Stacy C and Smith Shannon W
Current Estimated Value
Home Financials for this Owner
Home Financials are based on the most recent Mortgage that was taken out on this home.
Original Mortgage
$15,000
Outstanding Balance
$3,753
Interest Rate
3.83%
Mortgage Type
New Conventional
Estimated Equity
$296,593
Purchase Details
Closed on
Nov 30, 2007
Sold by
Kretzmann Lawrence F
Bought by
Catalan Stacy C
Home Financials for this Owner
Home Financials are based on the most recent Mortgage that was taken out on this home.
Original Mortgage
$970
Interest Rate
6.31%
Mortgage Type
Second Mortgage Made To Cover Down Payment
Purchase Details
Closed on
Sep 14, 1992
Sold by
Kretzmann Theodore A
Bought by
Kretzmann Theodore A Trustee
Create a Home Valuation Report for This Property
The Home Valuation Report is an in-depth analysis detailing your home's value as well as a comparison with similar homes in the area
Home Values in the Area
Average Home Value in this Area
Purchase History
| Date | Buyer | Sale Price | Title Company |
|---|---|---|---|
| Smith Stacy C | -- | Sas Title Agency Ltd | |
| Catalan Stacy C | $97,000 | None Available | |
| Kretzmann Theodore A Trustee | -- | -- |
Source: Public Records
Mortgage History
| Date | Status | Borrower | Loan Amount |
|---|---|---|---|
| Open | Smith Stacy C | $15,000 | |
| Closed | Catalan Stacy C | $970 | |
| Open | Catalan Stacy C | $97,000 |
Source: Public Records
Tax History Compared to Growth
Tax History
| Year | Tax Paid | Tax Assessment Tax Assessment Total Assessment is a certain percentage of the fair market value that is determined by local assessors to be the total taxable value of land and additions on the property. | Land | Improvement |
|---|---|---|---|---|
| 2024 | $7,684 | $79,130 | $16,560 | $62,570 |
| 2023 | $3,182 | $79,130 | $16,560 | $62,570 |
| 2022 | $3,221 | $79,130 | $16,560 | $62,570 |
| 2021 | $2,584 | $61,740 | $15,050 | $46,690 |
| 2020 | $2,483 | $61,740 | $15,050 | $46,690 |
| 2019 | $2,370 | $61,740 | $15,050 | $46,690 |
| 2018 | $2,188 | $53,870 | $15,050 | $38,820 |
| 2017 | $2,189 | $53,870 | $15,050 | $38,820 |
| 2016 | $2,029 | $53,870 | $15,050 | $38,820 |
| 2015 | $2,023 | $52,070 | $15,050 | $37,020 |
| 2014 | $1,930 | $52,070 | $15,050 | $37,020 |
| 2013 | $1,930 | $52,070 | $15,050 | $37,020 |
Source: Public Records
Map
Nearby Homes
- 1760 Rainbow Dr NE
- 1700 Rosewood Dr NE
- 0 Old Millersport Rd NE Unit Lot 10 225033491
- 0 Old Millersport Rd NE Unit 225010386
- 0 Old Millersport Rd NE Unit Tract 8 224028101
- 2444 Sheridan Dr
- 2149 Pleasantview Dr NE
- 1801 Pleasantview Dr NE
- 1976 Breed Hill Ct
- 0 Declaration Dr W Unit 219044159
- 1669 Lexington Dr
- 715 Sherman Bluff Way Unit 14715
- 706 Sherman Bluff Way Unit 1706
- 1523 Fuller Ct
- 1916 Country Place
- 0 Lucille Dr NE
- 1189 Ridge Rd NE
- 0 Tschopp Rd NE Unit Lot 33 225027324
- 0 Tschopp Rd NE Unit Lot 17 225027320
- 3155 Old Millersport Rd NE
- 1425 Rainbow Dr NE
- 1357 Rainbow Dr NE
- 1325 Ridgewood Way NE
- 1449 Rainbow Dr NE
- 1406 Rainbow Dr NE
- 1388 Rainbow Dr NE
- 1424 Rainbow Dr NE
- 1424 Rainbow Dr NE
- 1463 Rainbow Dr NE
- 1370 Rainbow Dr NE
- 1442 Rainbow Dr NE
- 1311 Ridgewood Way NE
- 00 Midway Blvd NE
- 0 Midway Blvd NE
- 1481 Rainbow Dr NE
- 1460 Rainbow Dr NE
- 1310 Ridgewood Way NE
- 2077 Sheridan Dr
- 1332 Rainbow Dr NE
- 1401 Hillbrook Dr NE