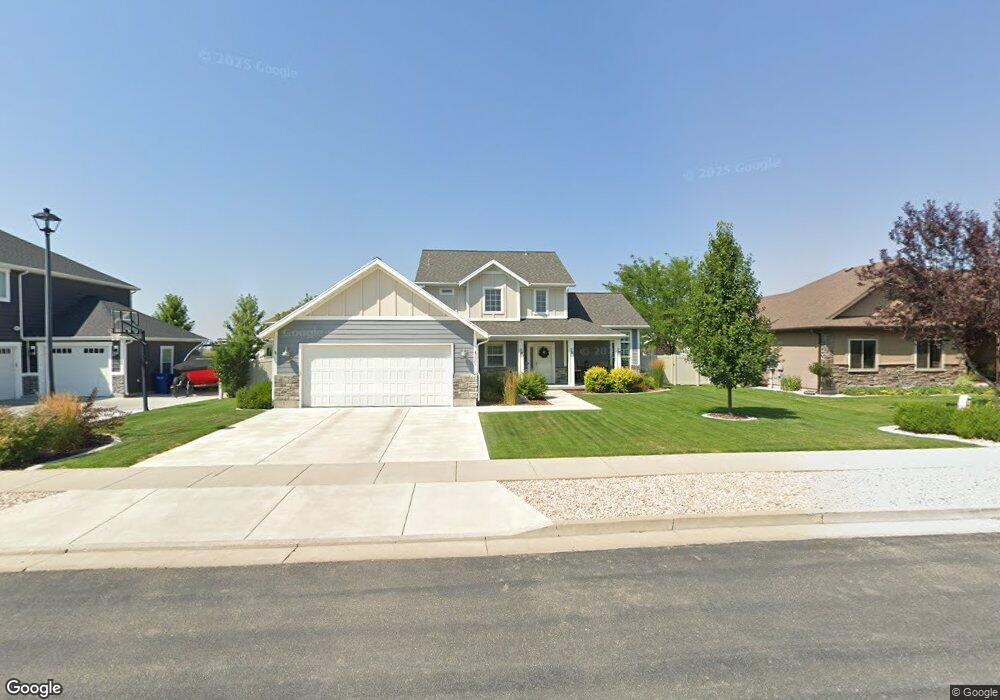
1395 W 2930 S Unit 120 Nibley, UT 84321
Estimated Value: $571,680 - $612,000
--
Bed
--
Bath
2,565
Sq Ft
$233/Sq Ft
Est. Value
About This Home
This home is located at 1395 W 2930 S Unit 120, Nibley, UT 84321 and is currently estimated at $598,170, approximately $233 per square foot. 1395 W 2930 S Unit 120 is a home located in Cache County with nearby schools including Heritage School, South Cache Middle School, and Spring Creek Middle School.
Ownership History
Date
Name
Owned For
Owner Type
Purchase Details
Closed on
May 30, 2019
Sold by
Rds Construction Inc
Bought by
Dixon Tyler J and Dixon Marianne
Current Estimated Value
Home Financials for this Owner
Home Financials are based on the most recent Mortgage that was taken out on this home.
Original Mortgage
$285,600
Outstanding Balance
$251,112
Interest Rate
4.1%
Mortgage Type
New Conventional
Estimated Equity
$347,058
Purchase Details
Closed on
Jun 4, 2018
Sold by
Titensor Andrew
Bought by
Rds Construction Inc
Home Financials for this Owner
Home Financials are based on the most recent Mortgage that was taken out on this home.
Original Mortgage
$185,000
Interest Rate
4.5%
Mortgage Type
Seller Take Back
Purchase Details
Closed on
Mar 18, 2015
Sold by
Stonebridge West Properties Llc
Bought by
Titensor Andrew
Create a Home Valuation Report for This Property
The Home Valuation Report is an in-depth analysis detailing your home's value as well as a comparison with similar homes in the area
Home Values in the Area
Average Home Value in this Area
Purchase History
| Date | Buyer | Sale Price | Title Company |
|---|---|---|---|
| Dixon Tyler J | -- | Cache Title Logan | |
| Rds Construction Inc | -- | Northern Title Company | |
| Titensor Andrew | -- | Northern Title Company |
Source: Public Records
Mortgage History
| Date | Status | Borrower | Loan Amount |
|---|---|---|---|
| Open | Dixon Tyler J | $285,600 | |
| Previous Owner | Rds Construction Inc | $185,000 |
Source: Public Records
Tax History Compared to Growth
Tax History
| Year | Tax Paid | Tax Assessment Tax Assessment Total Assessment is a certain percentage of the fair market value that is determined by local assessors to be the total taxable value of land and additions on the property. | Land | Improvement |
|---|---|---|---|---|
| 2024 | $2,638 | $328,355 | $0 | $0 |
| 2023 | $2,763 | $321,970 | $0 | $0 |
| 2022 | $2,876 | $321,970 | $0 | $0 |
| 2021 | $2,330 | $405,055 | $65,000 | $340,055 |
| 2020 | $2,179 | $360,700 | $65,000 | $295,700 |
| 2019 | $749 | $65,000 | $65,000 | $0 |
| 2018 | $531 | $45,000 | $45,000 | $0 |
| 2017 | $552 | $45,000 | $0 | $0 |
| 2016 | $558 | $45,000 | $0 | $0 |
| 2015 | $554 | $45,000 | $0 | $0 |
| 2014 | $537 | $45,000 | $0 | $0 |
| 2013 | $518 | $46,800 | $0 | $0 |
Source: Public Records
Map
Nearby Homes
- 1395 Nibley Pkwy Unit 120
- 1383 Nibley Pkwy Unit 119
- 1383 Nibley Pkwy
- 1383 Nibley Pkwy Unit 119
- 1383 W 2930 S Unit 119
- 1398 2870 S
- 1398 W 2870 S Unit 106
- 1369 Nibley Pkwy
- 1396 Nibley Pkwy Unit 1
- 1396 Nibley Pkwy Unit 1
- 1396 W 2930 S Unit 1
- 1396 Nibley Pkwy Unit 1
- 1396 Nibley Pkwy
- 1388 W 2870 S Unit 107
- 1310 W 2930 S Unit 7
- 1301 Nibley Pkwy Unit 114
- 1388 2870 S
- 1384 Nibley Pkwy
- 1389 W 2870 S Unit 105
- 1389 W 2870 S Unit 1O5